Adding Charts to a Custom Page
Step-by-Step Guide
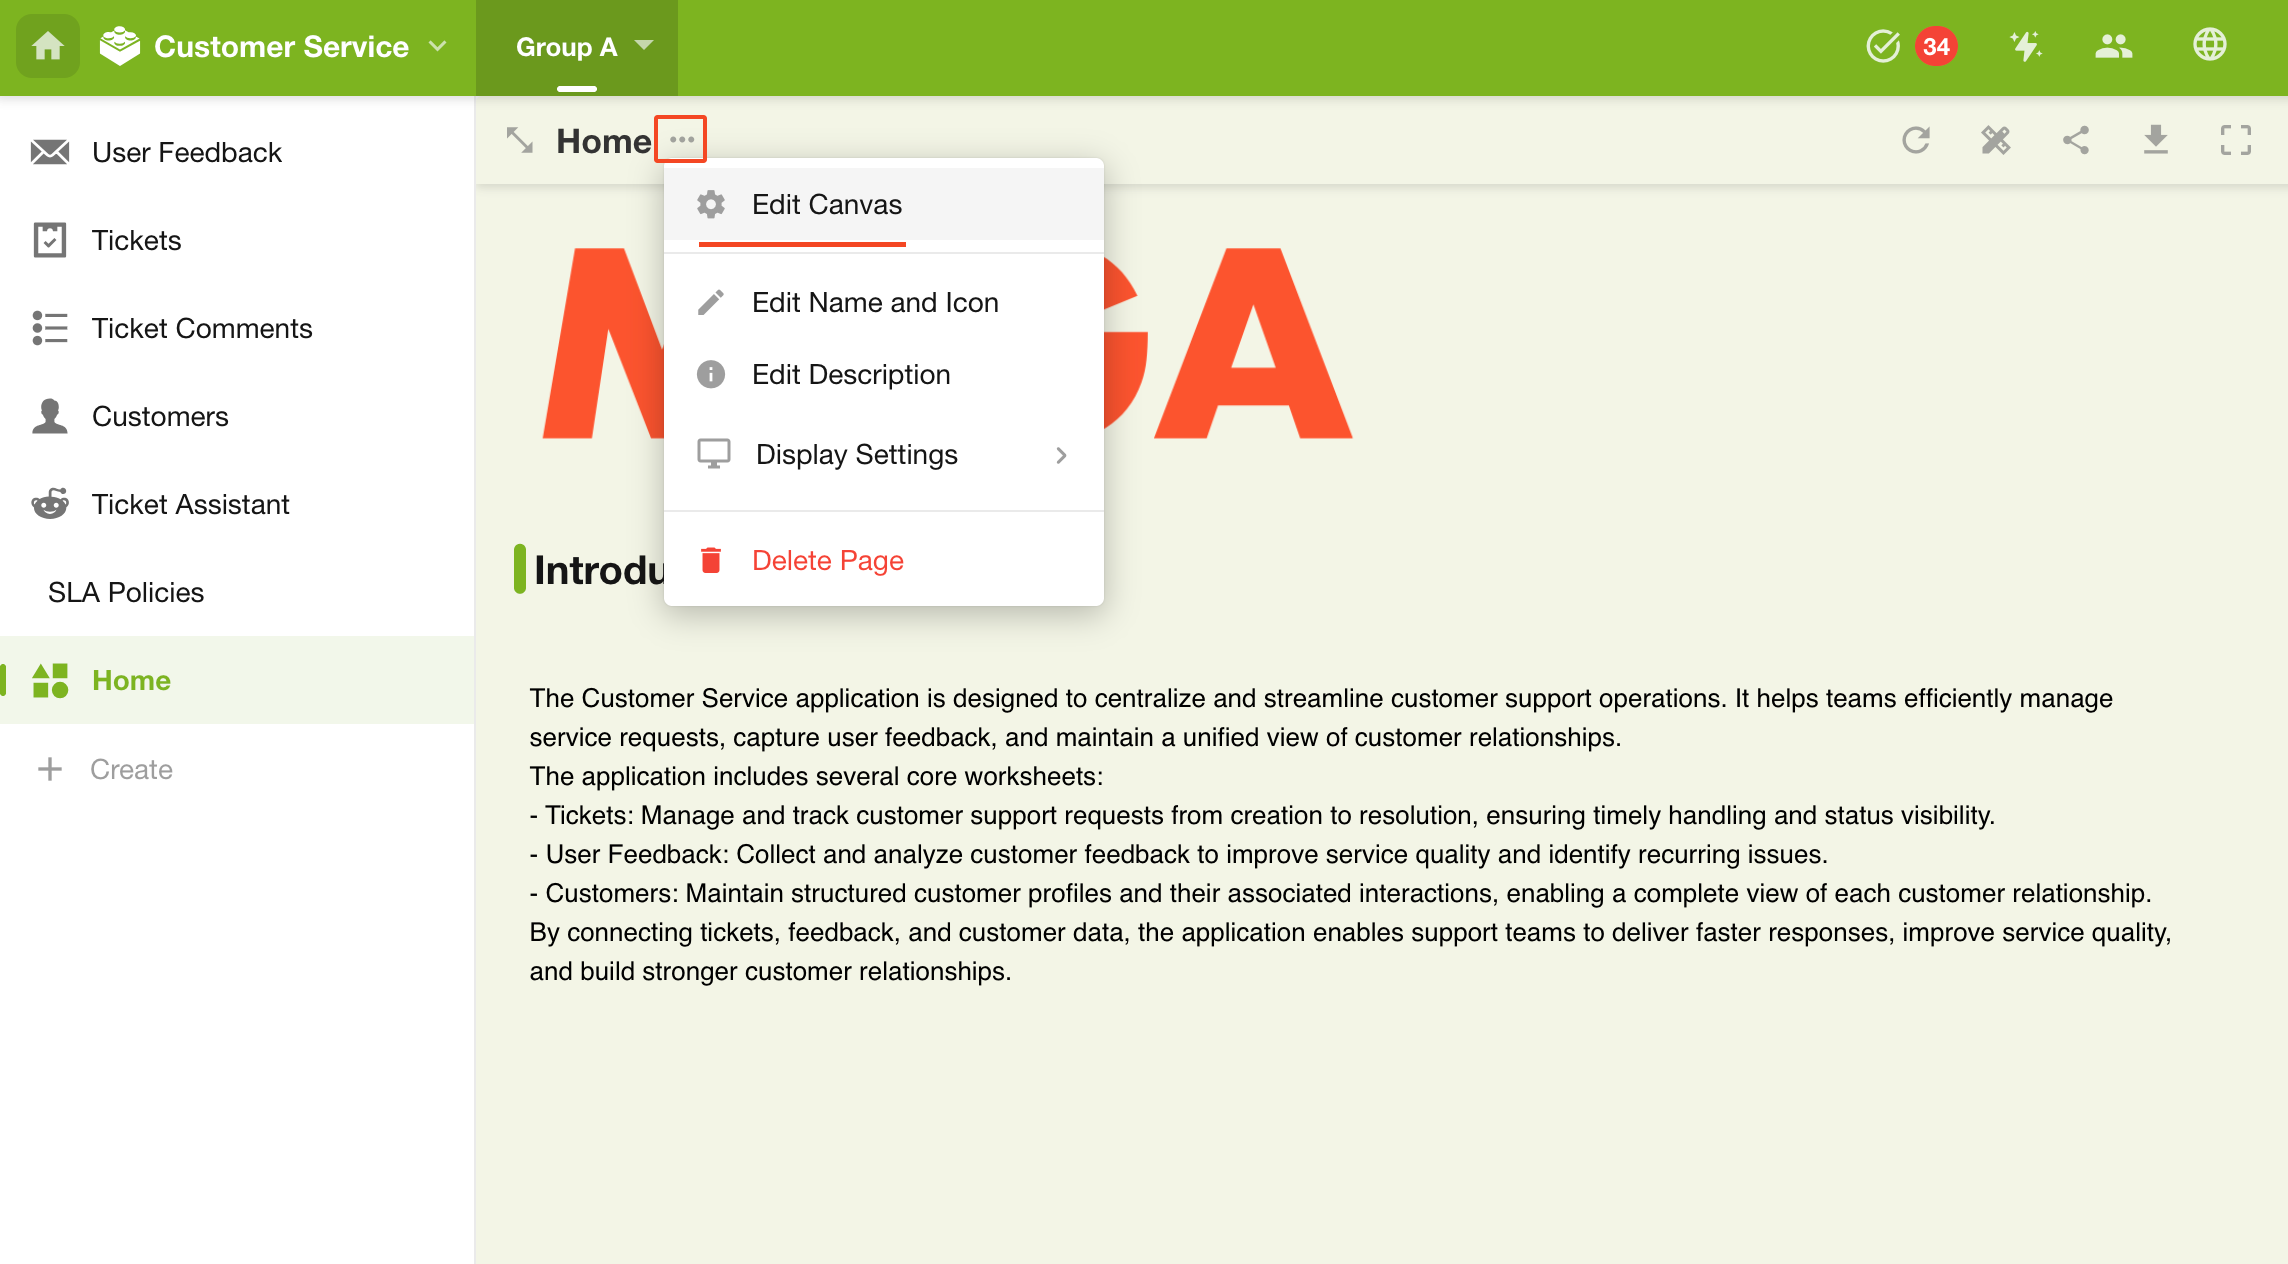
1. Go to the Custom Page Editing Page
2. Add a Chart Component
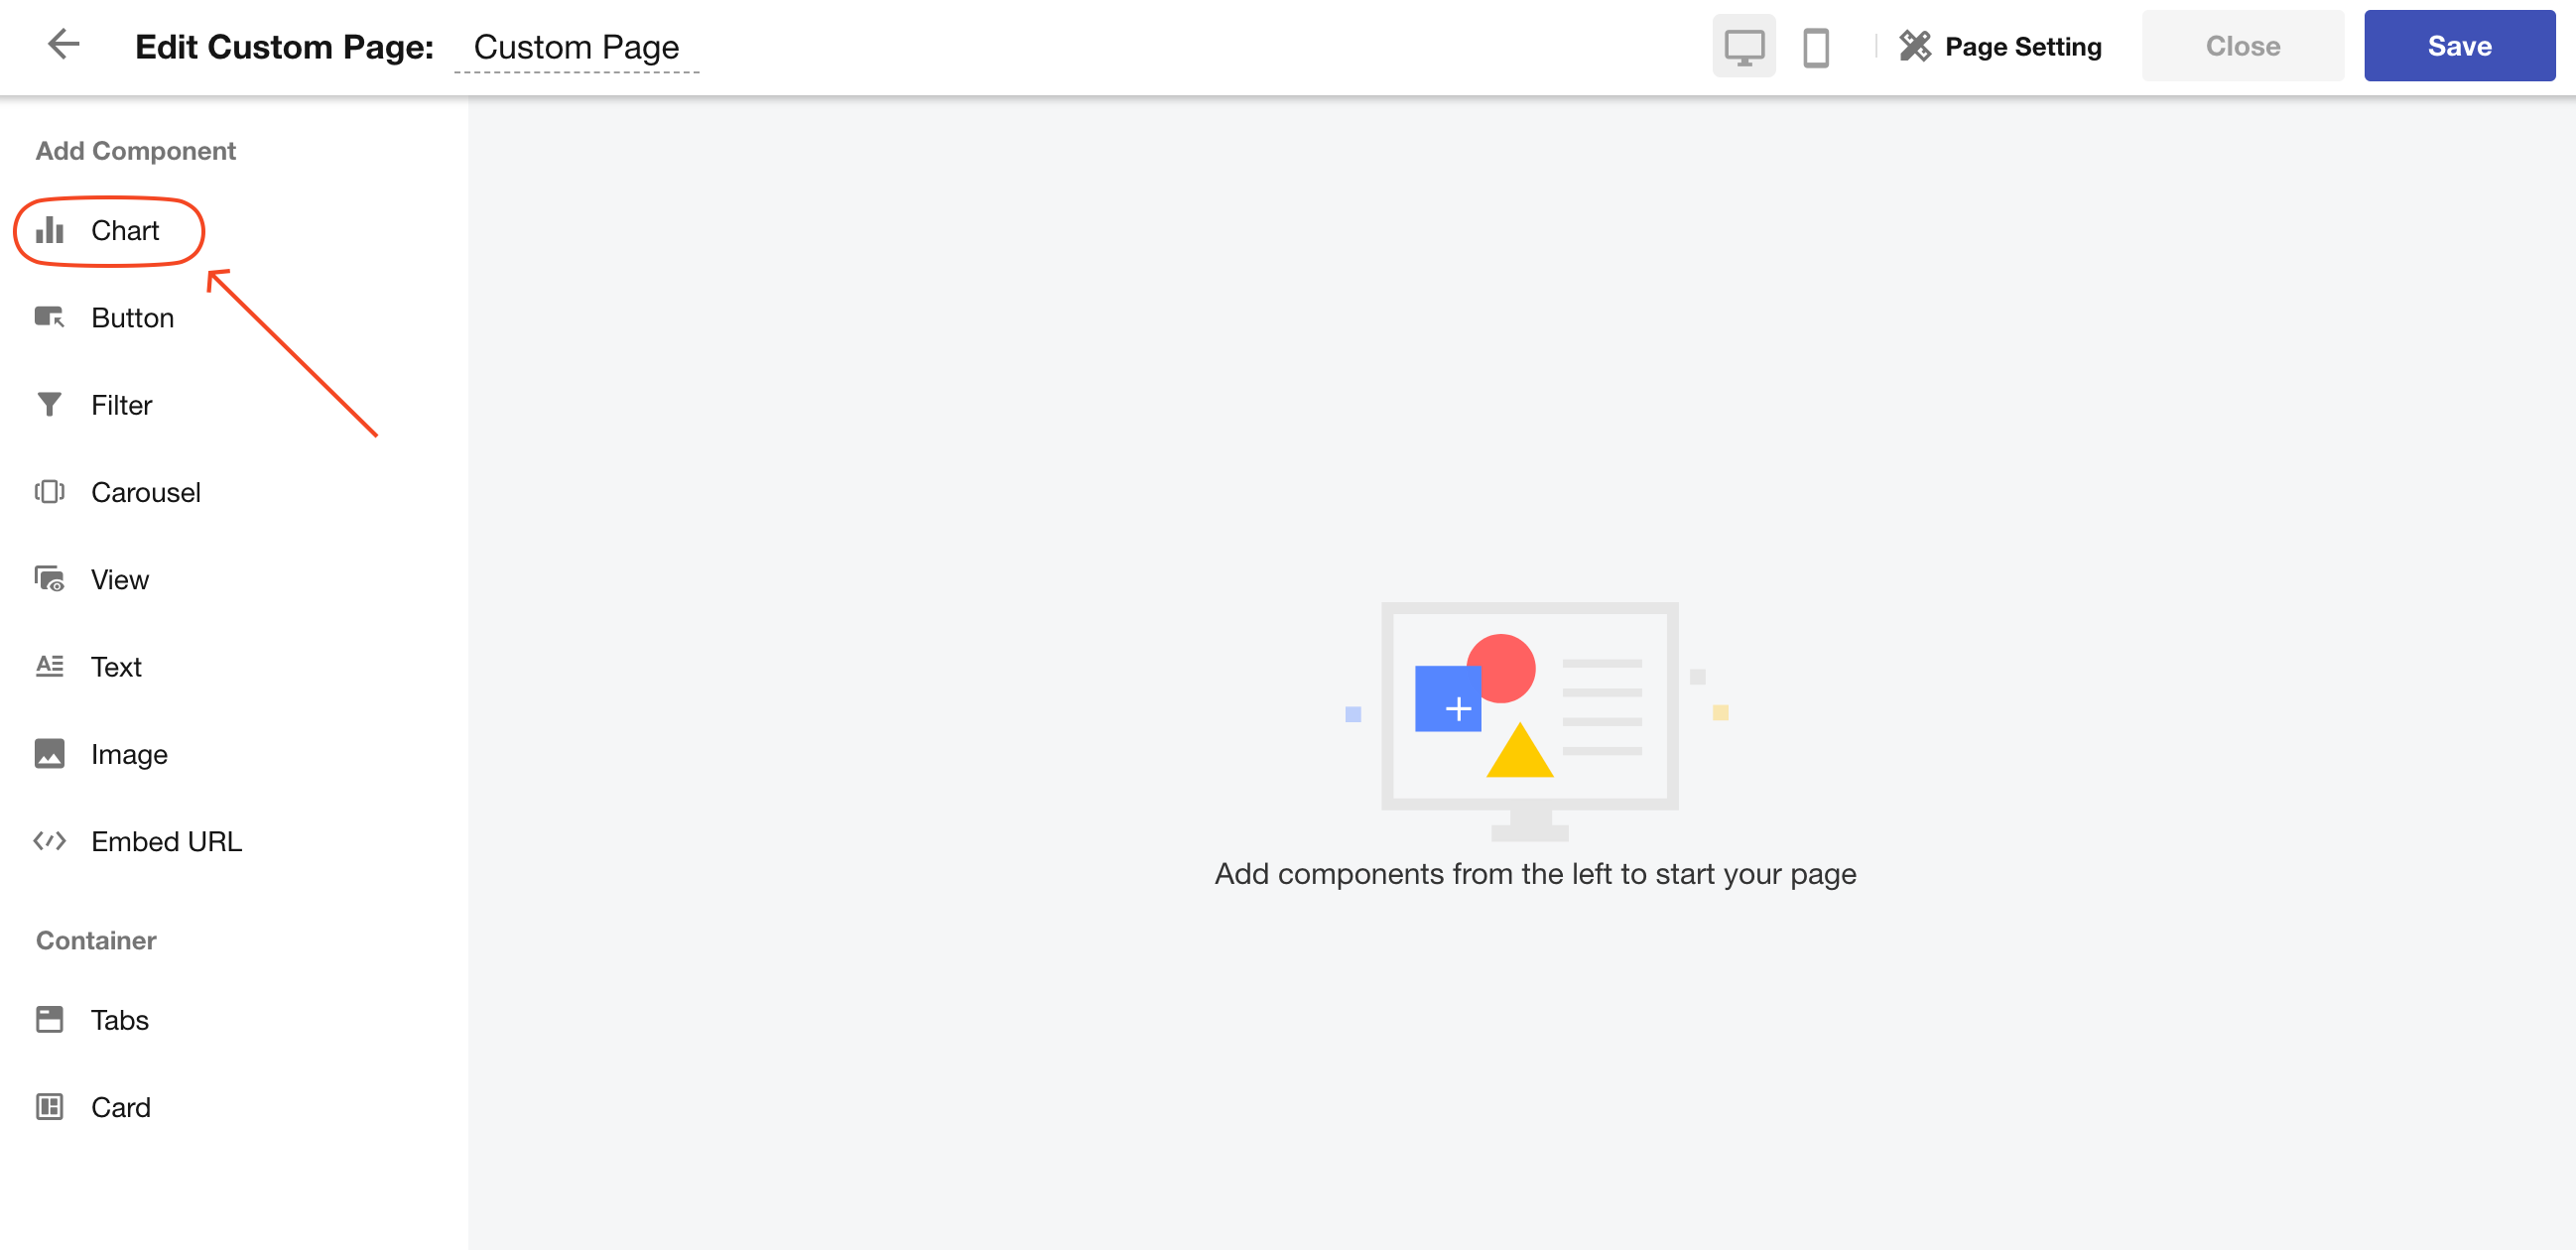
Note: A maximum of 30 charts can be added to a custom page.
3. Select the Worksheet and Chart Type
Example: Create a chart to display the distribution of sales leads by status.
-
Select the "Sales Leads" worksheet.
-
Choose the Pie Chart type.
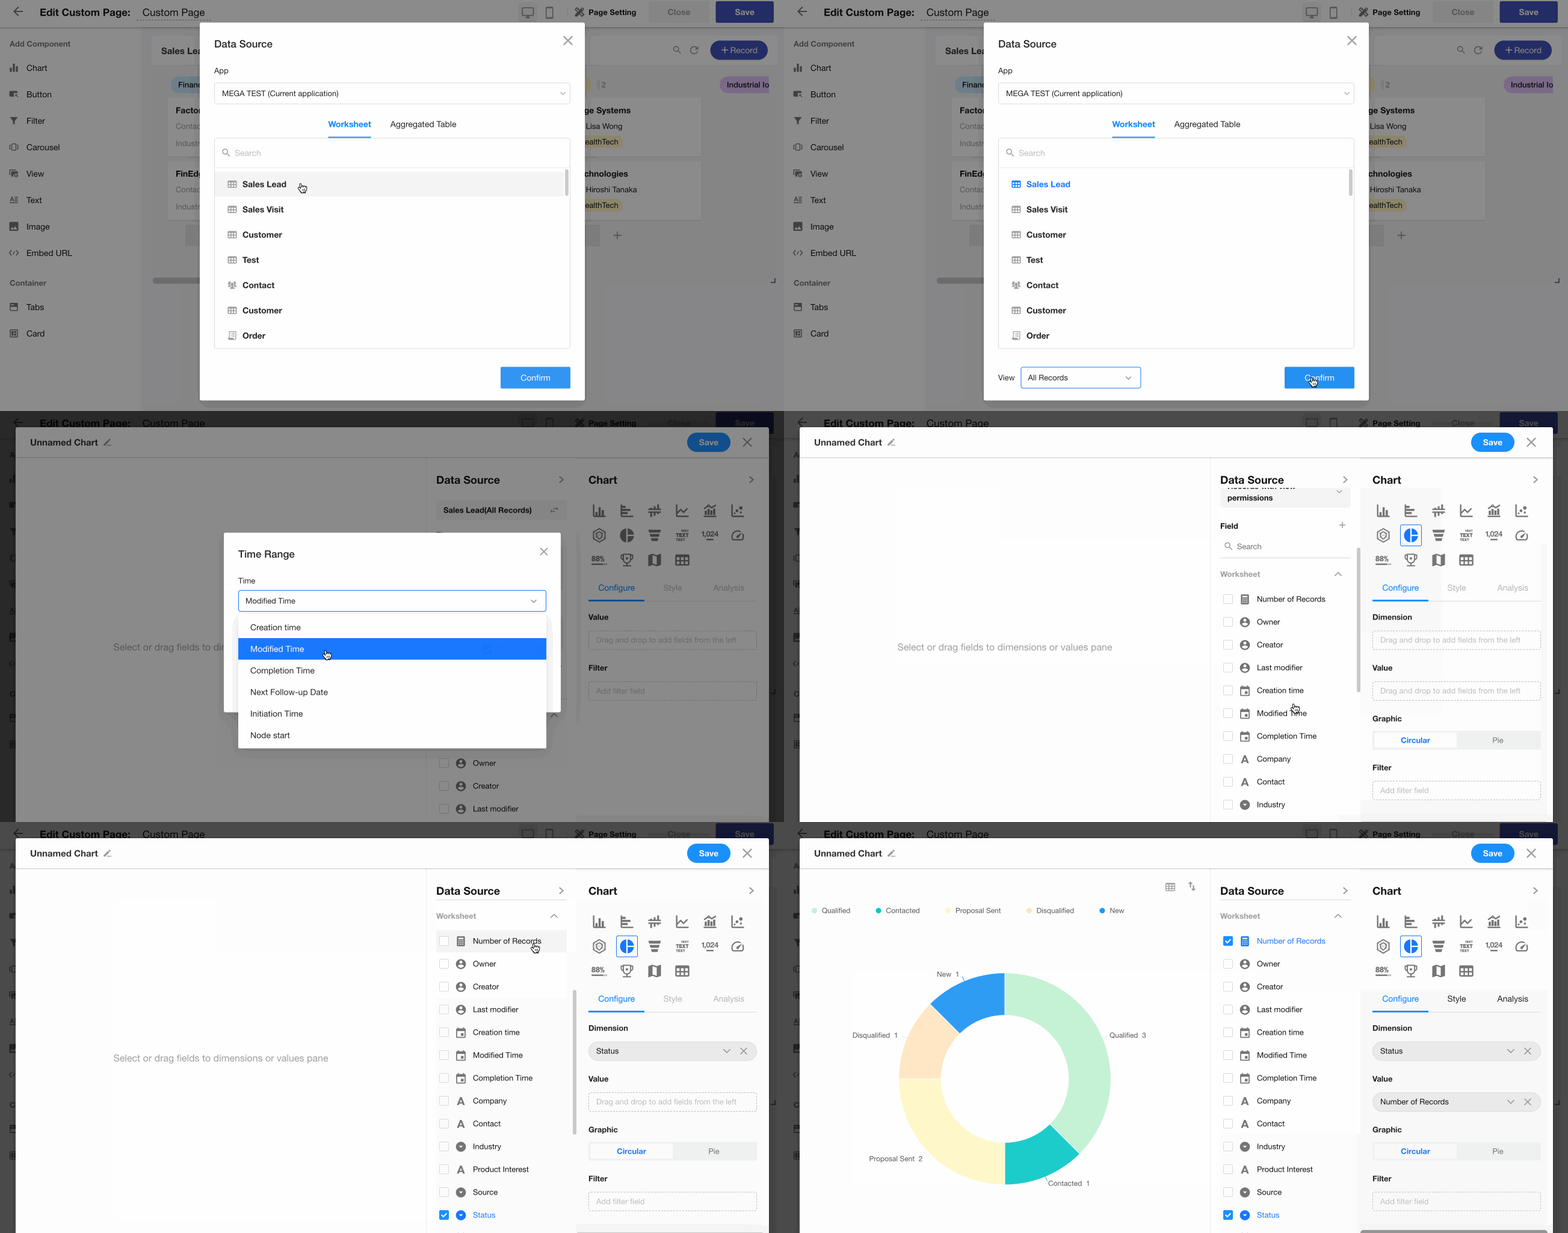
4. Configure the Chart Further
Learn more about chart configuration
5. Save the Chart Component
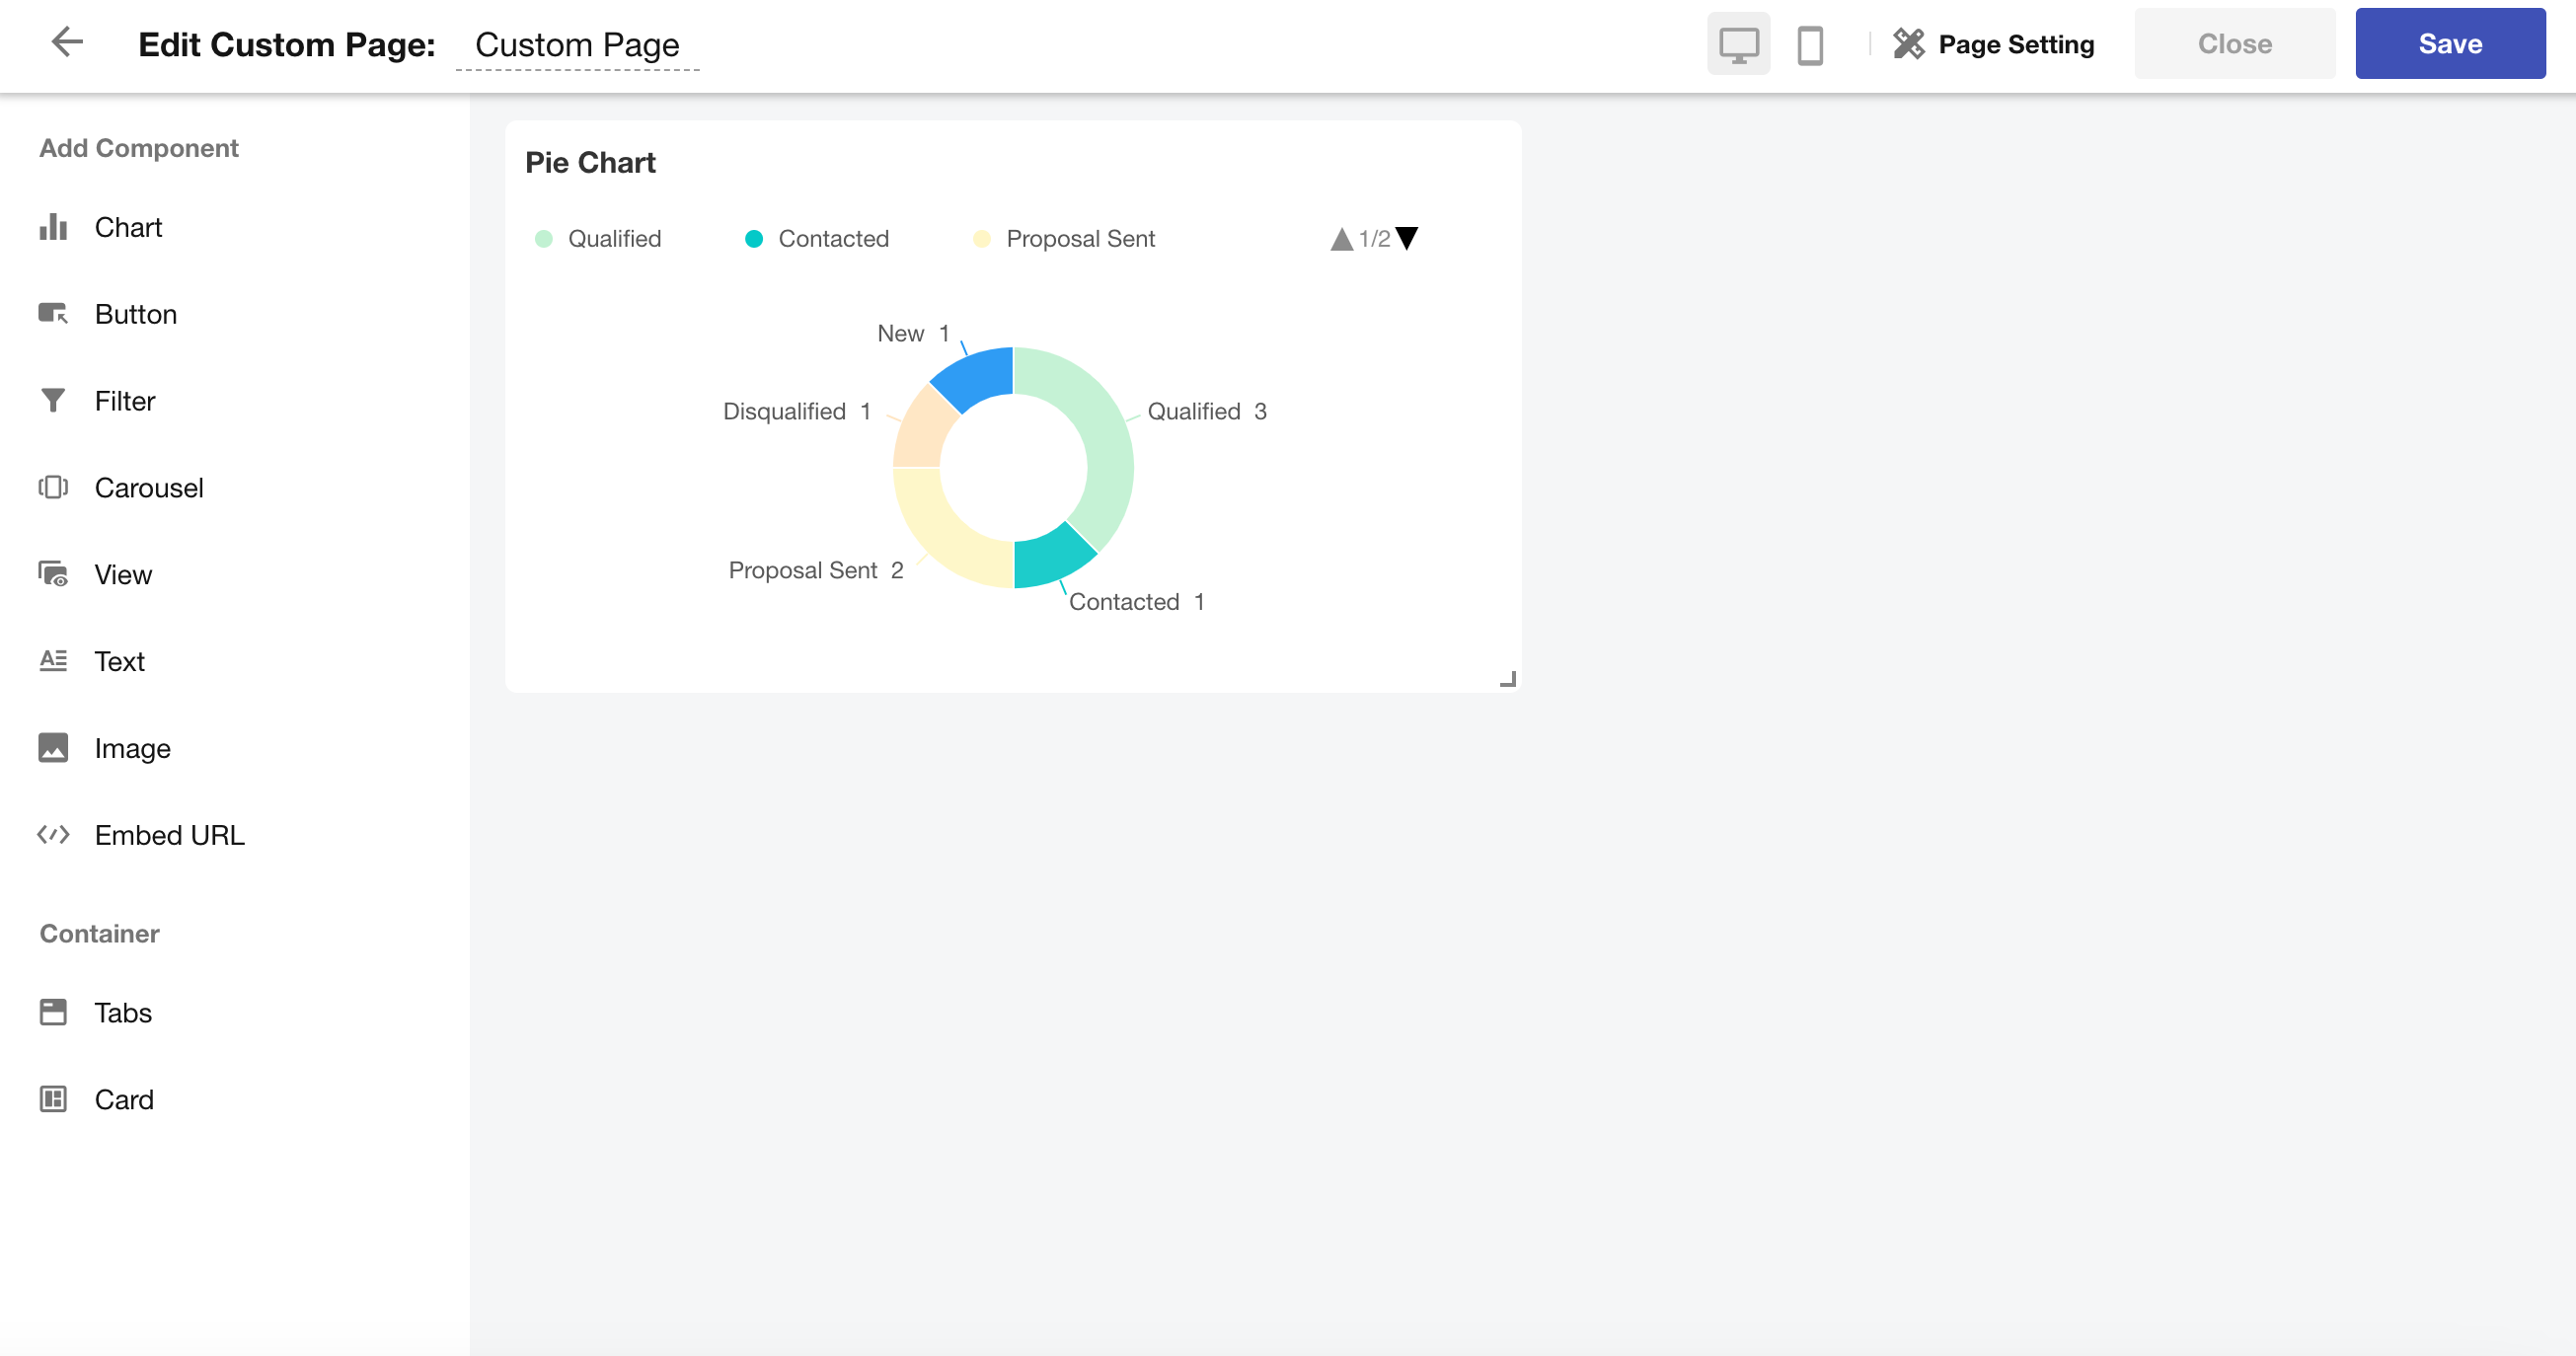
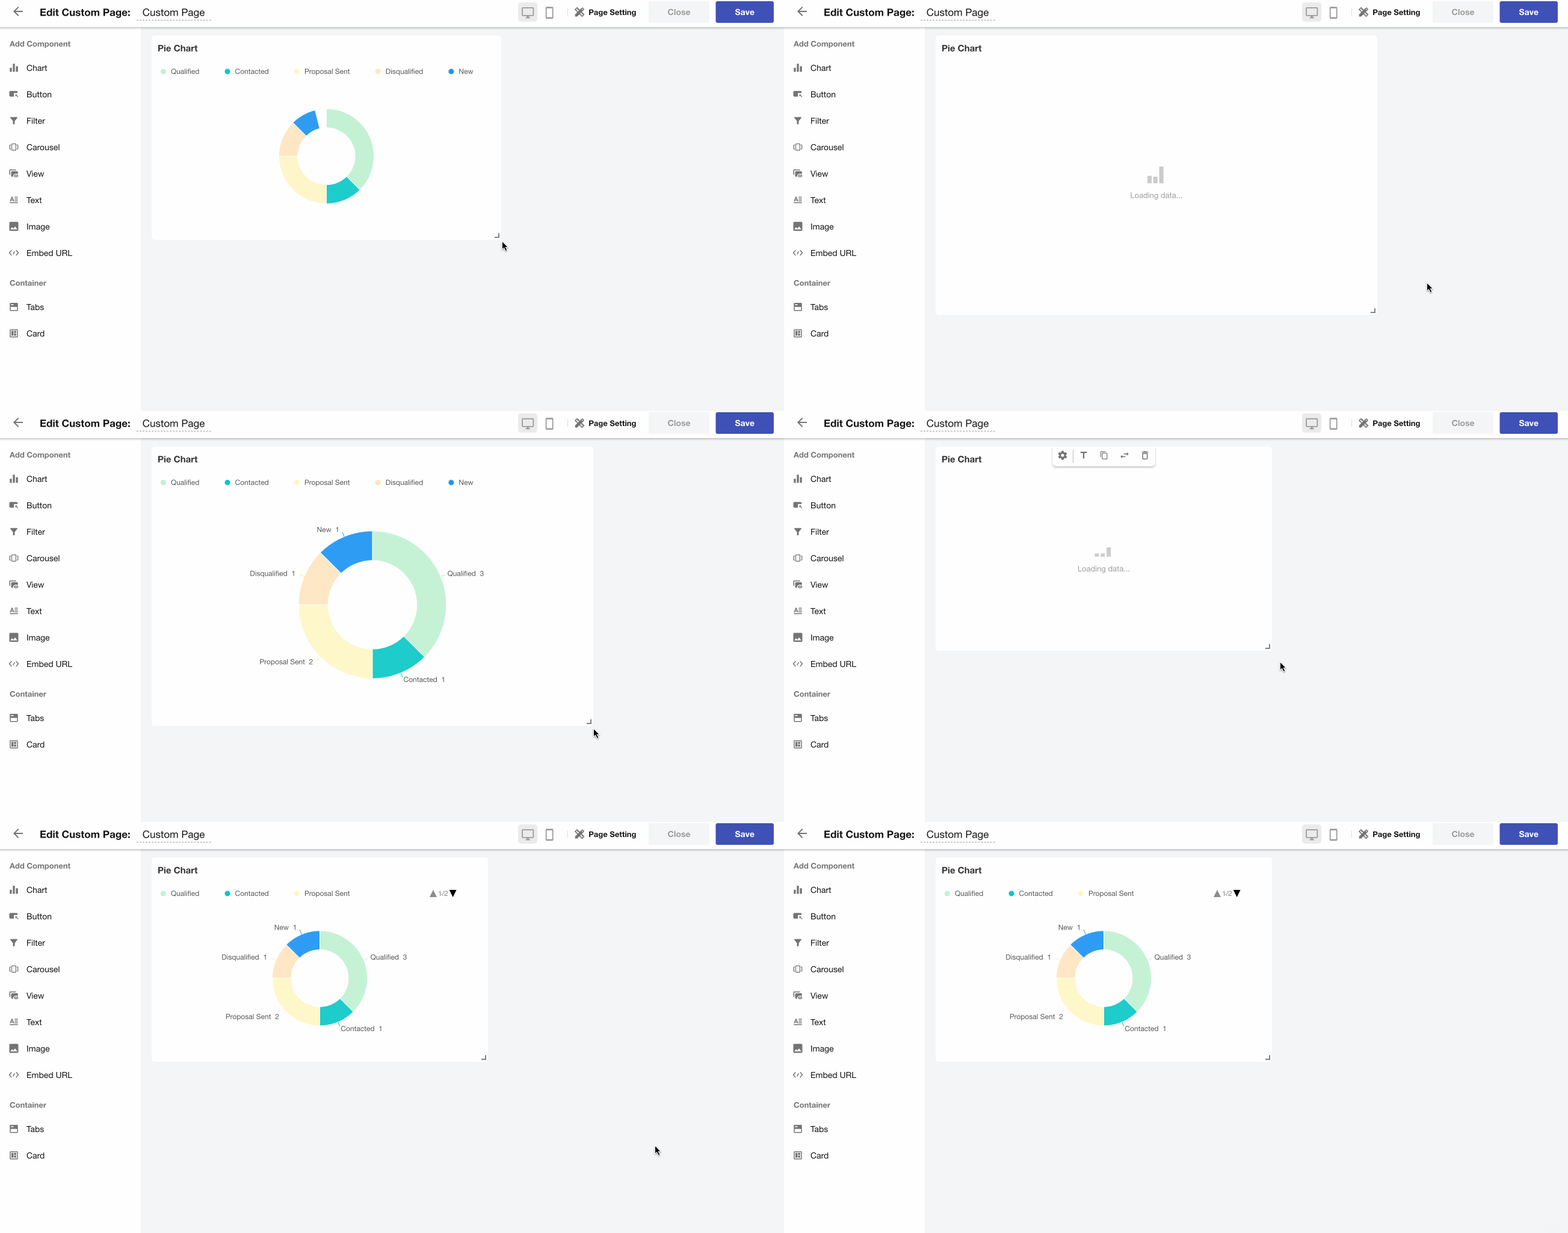
6. Resize the Chart
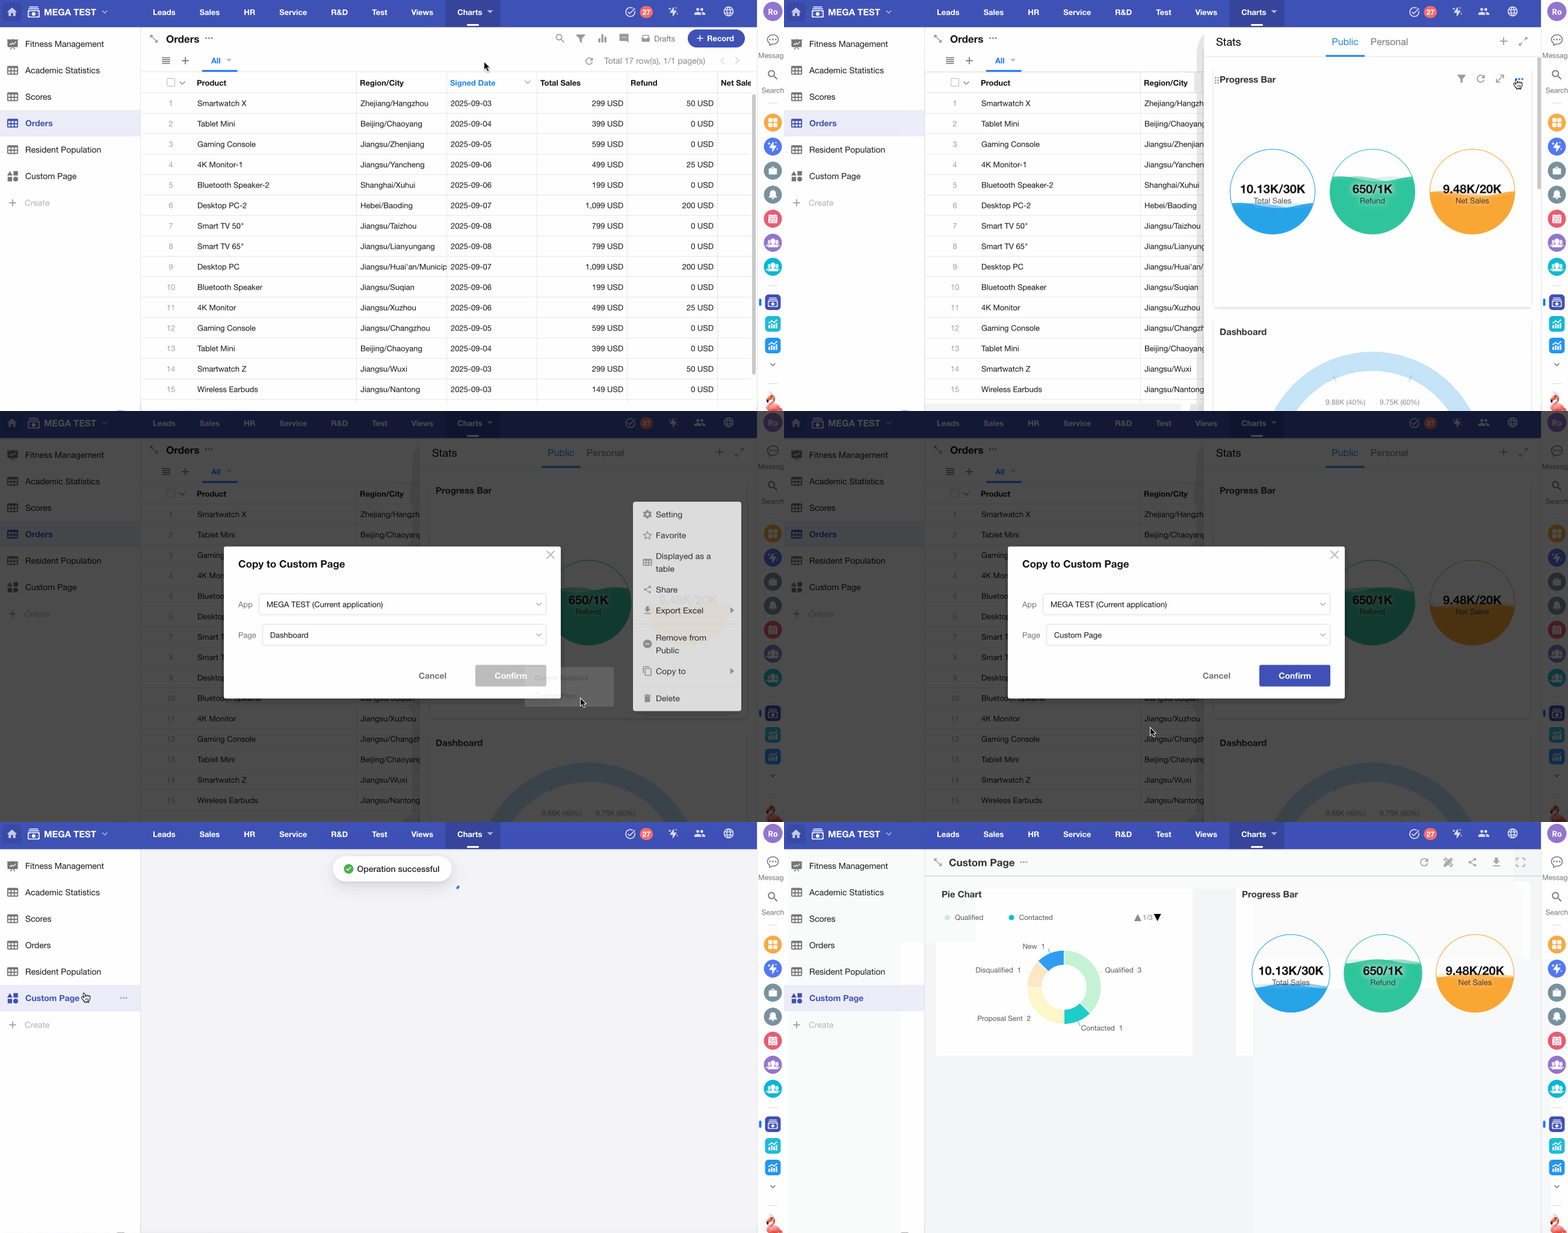
7. Copy Existing Charts from Worksheet to Custom Page
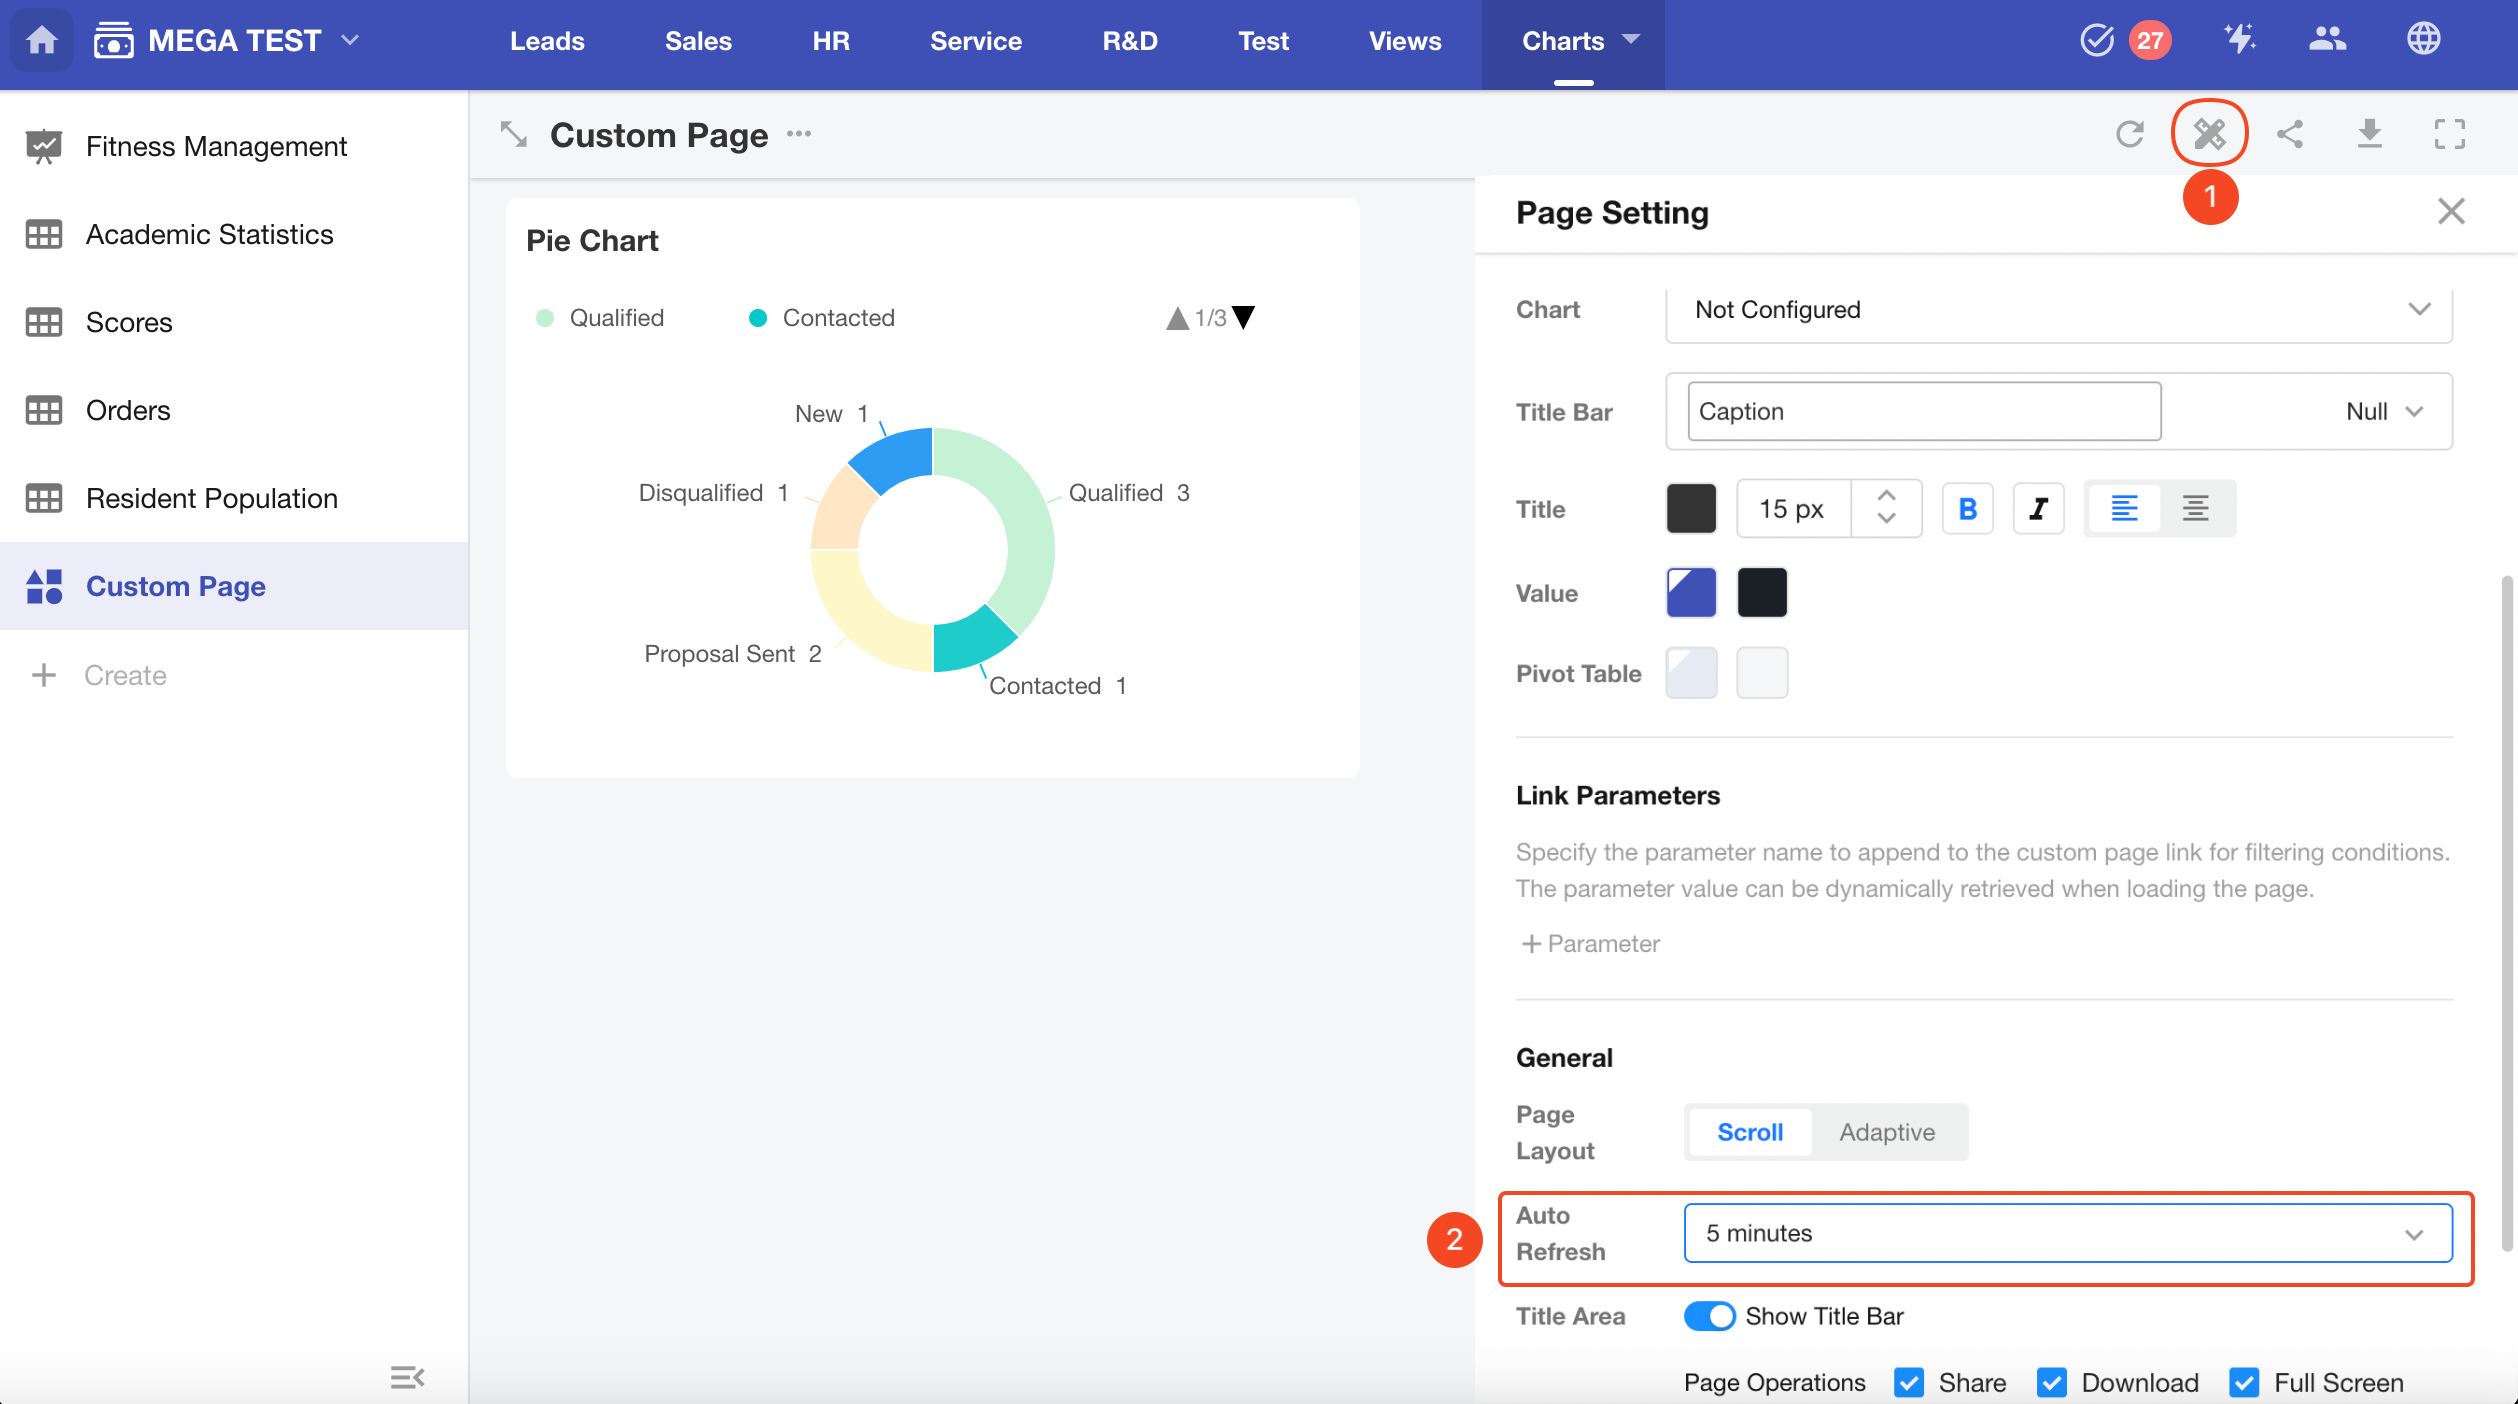
8. Enable Auto-Refresh
Charts in a custom page support scheduled refresh.
You can configure the refresh interval in the page settings.
Note: Only chart components support auto-refresh. Other embedded components such as views or URLs do not refresh automatically. You must manually refresh the browser page.
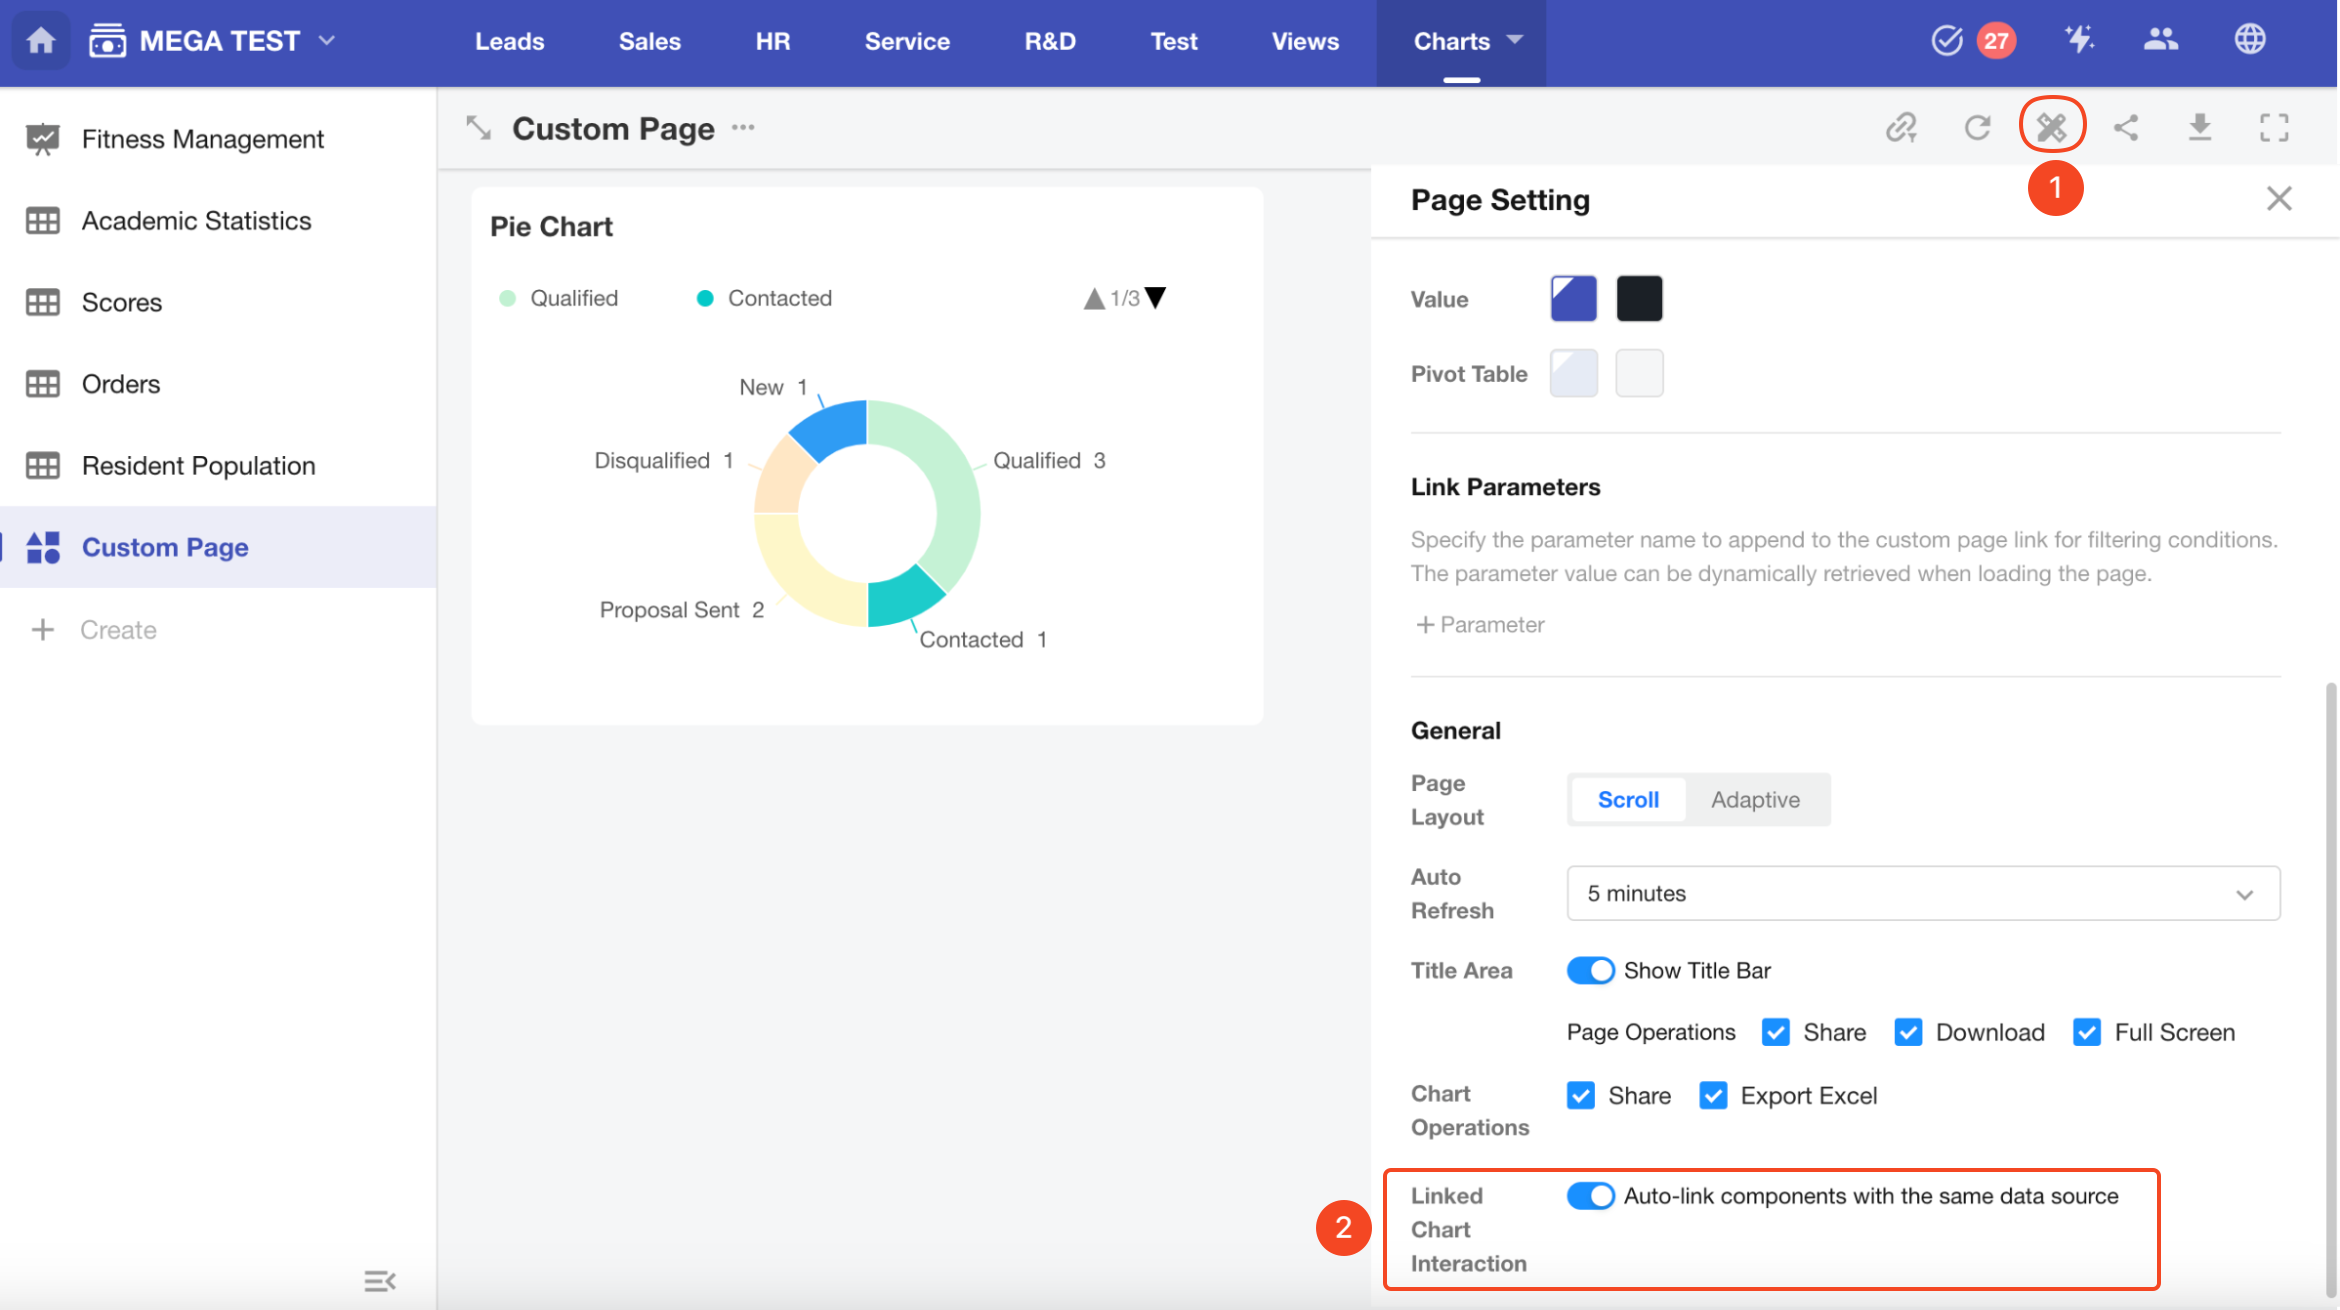
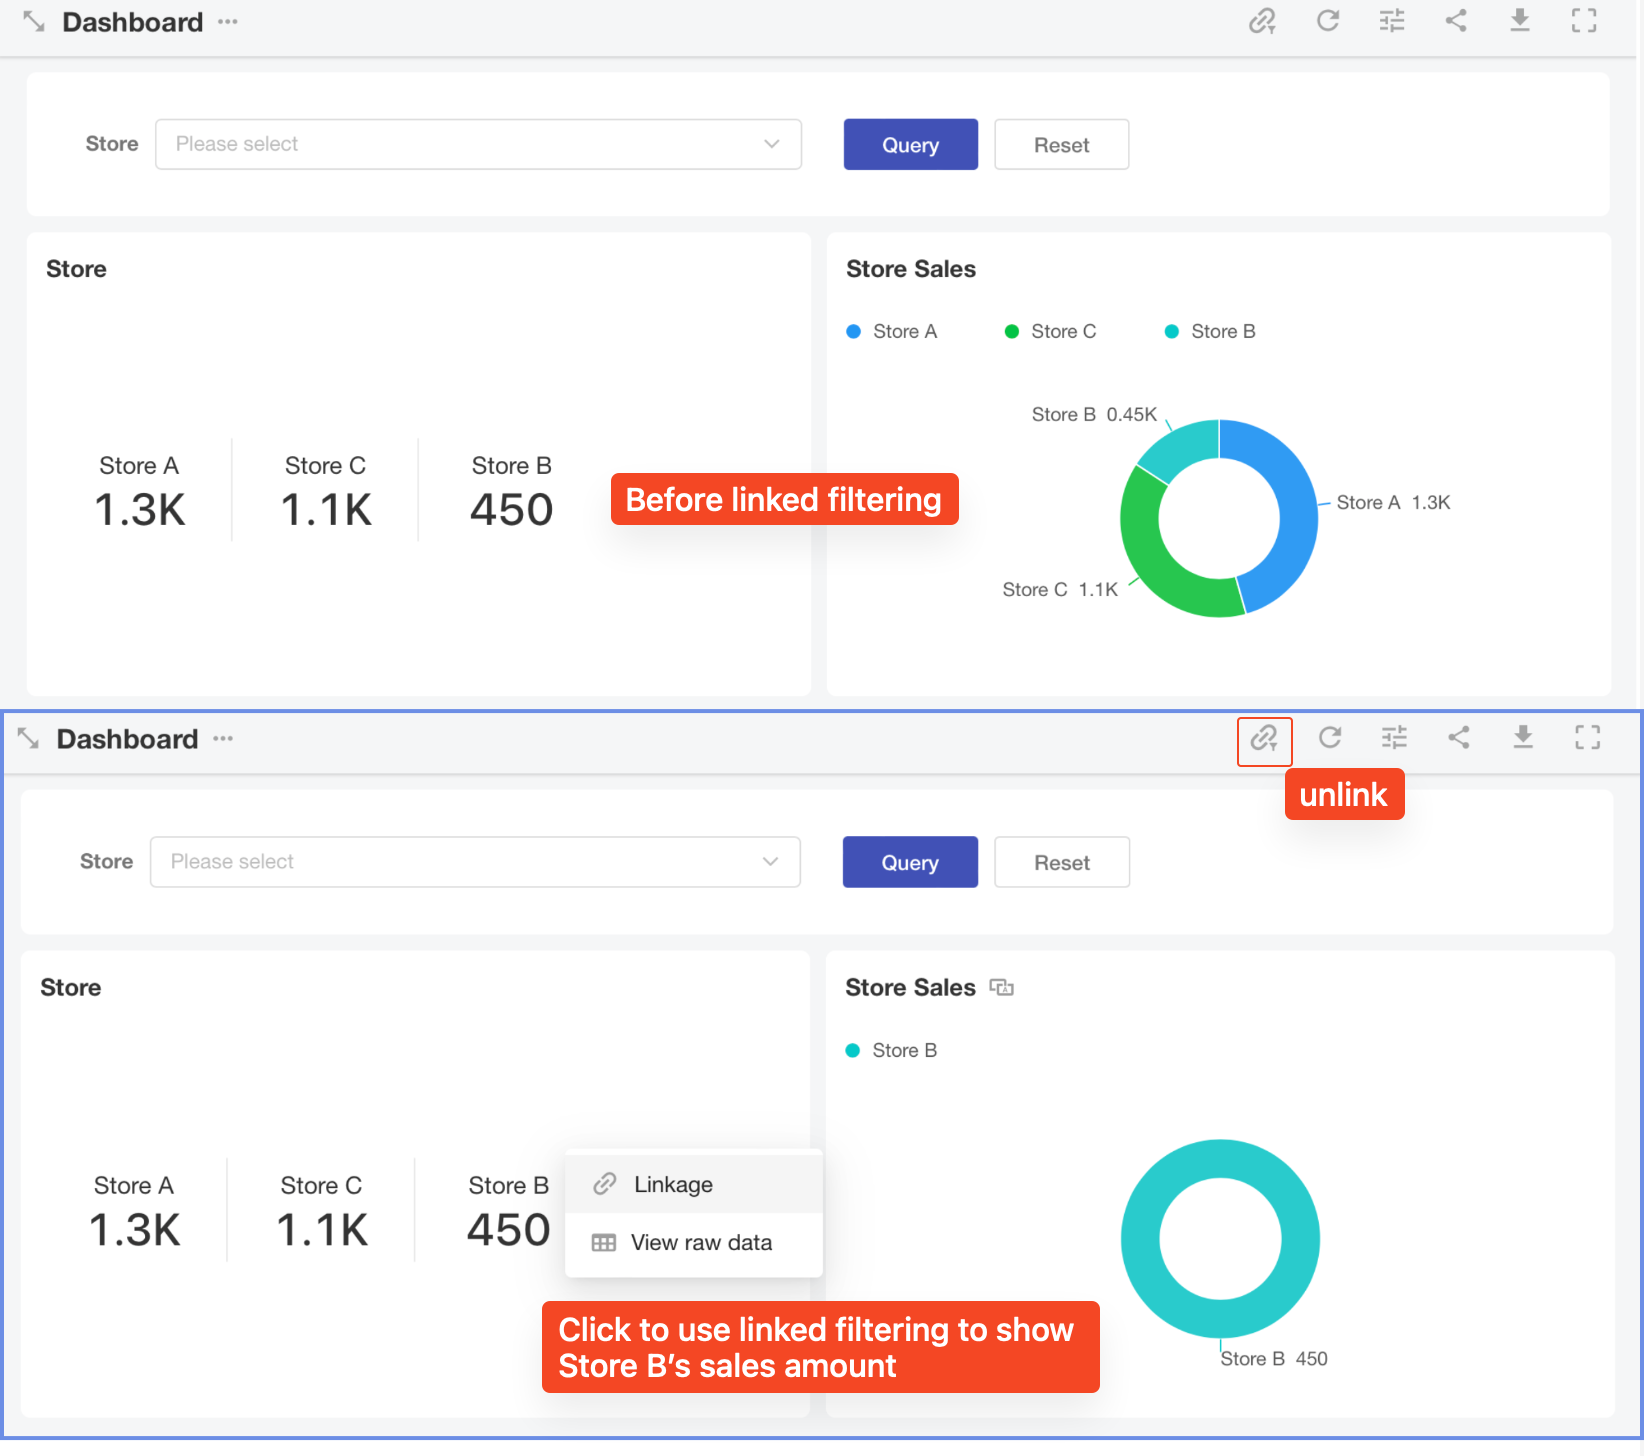
9. Linked Chart Interaction
Charts based on the same worksheet can interact with each other.
When you select a data point in one chart, it will highlight and filter related data in other linked charts.
Enable "Auto-link components with the same data source" in the page settings.
Note: Only charts added to a custom page support linked interactions.
Result Preview:
Was this document helpful?