Introduction to Statistical Charts
Overview
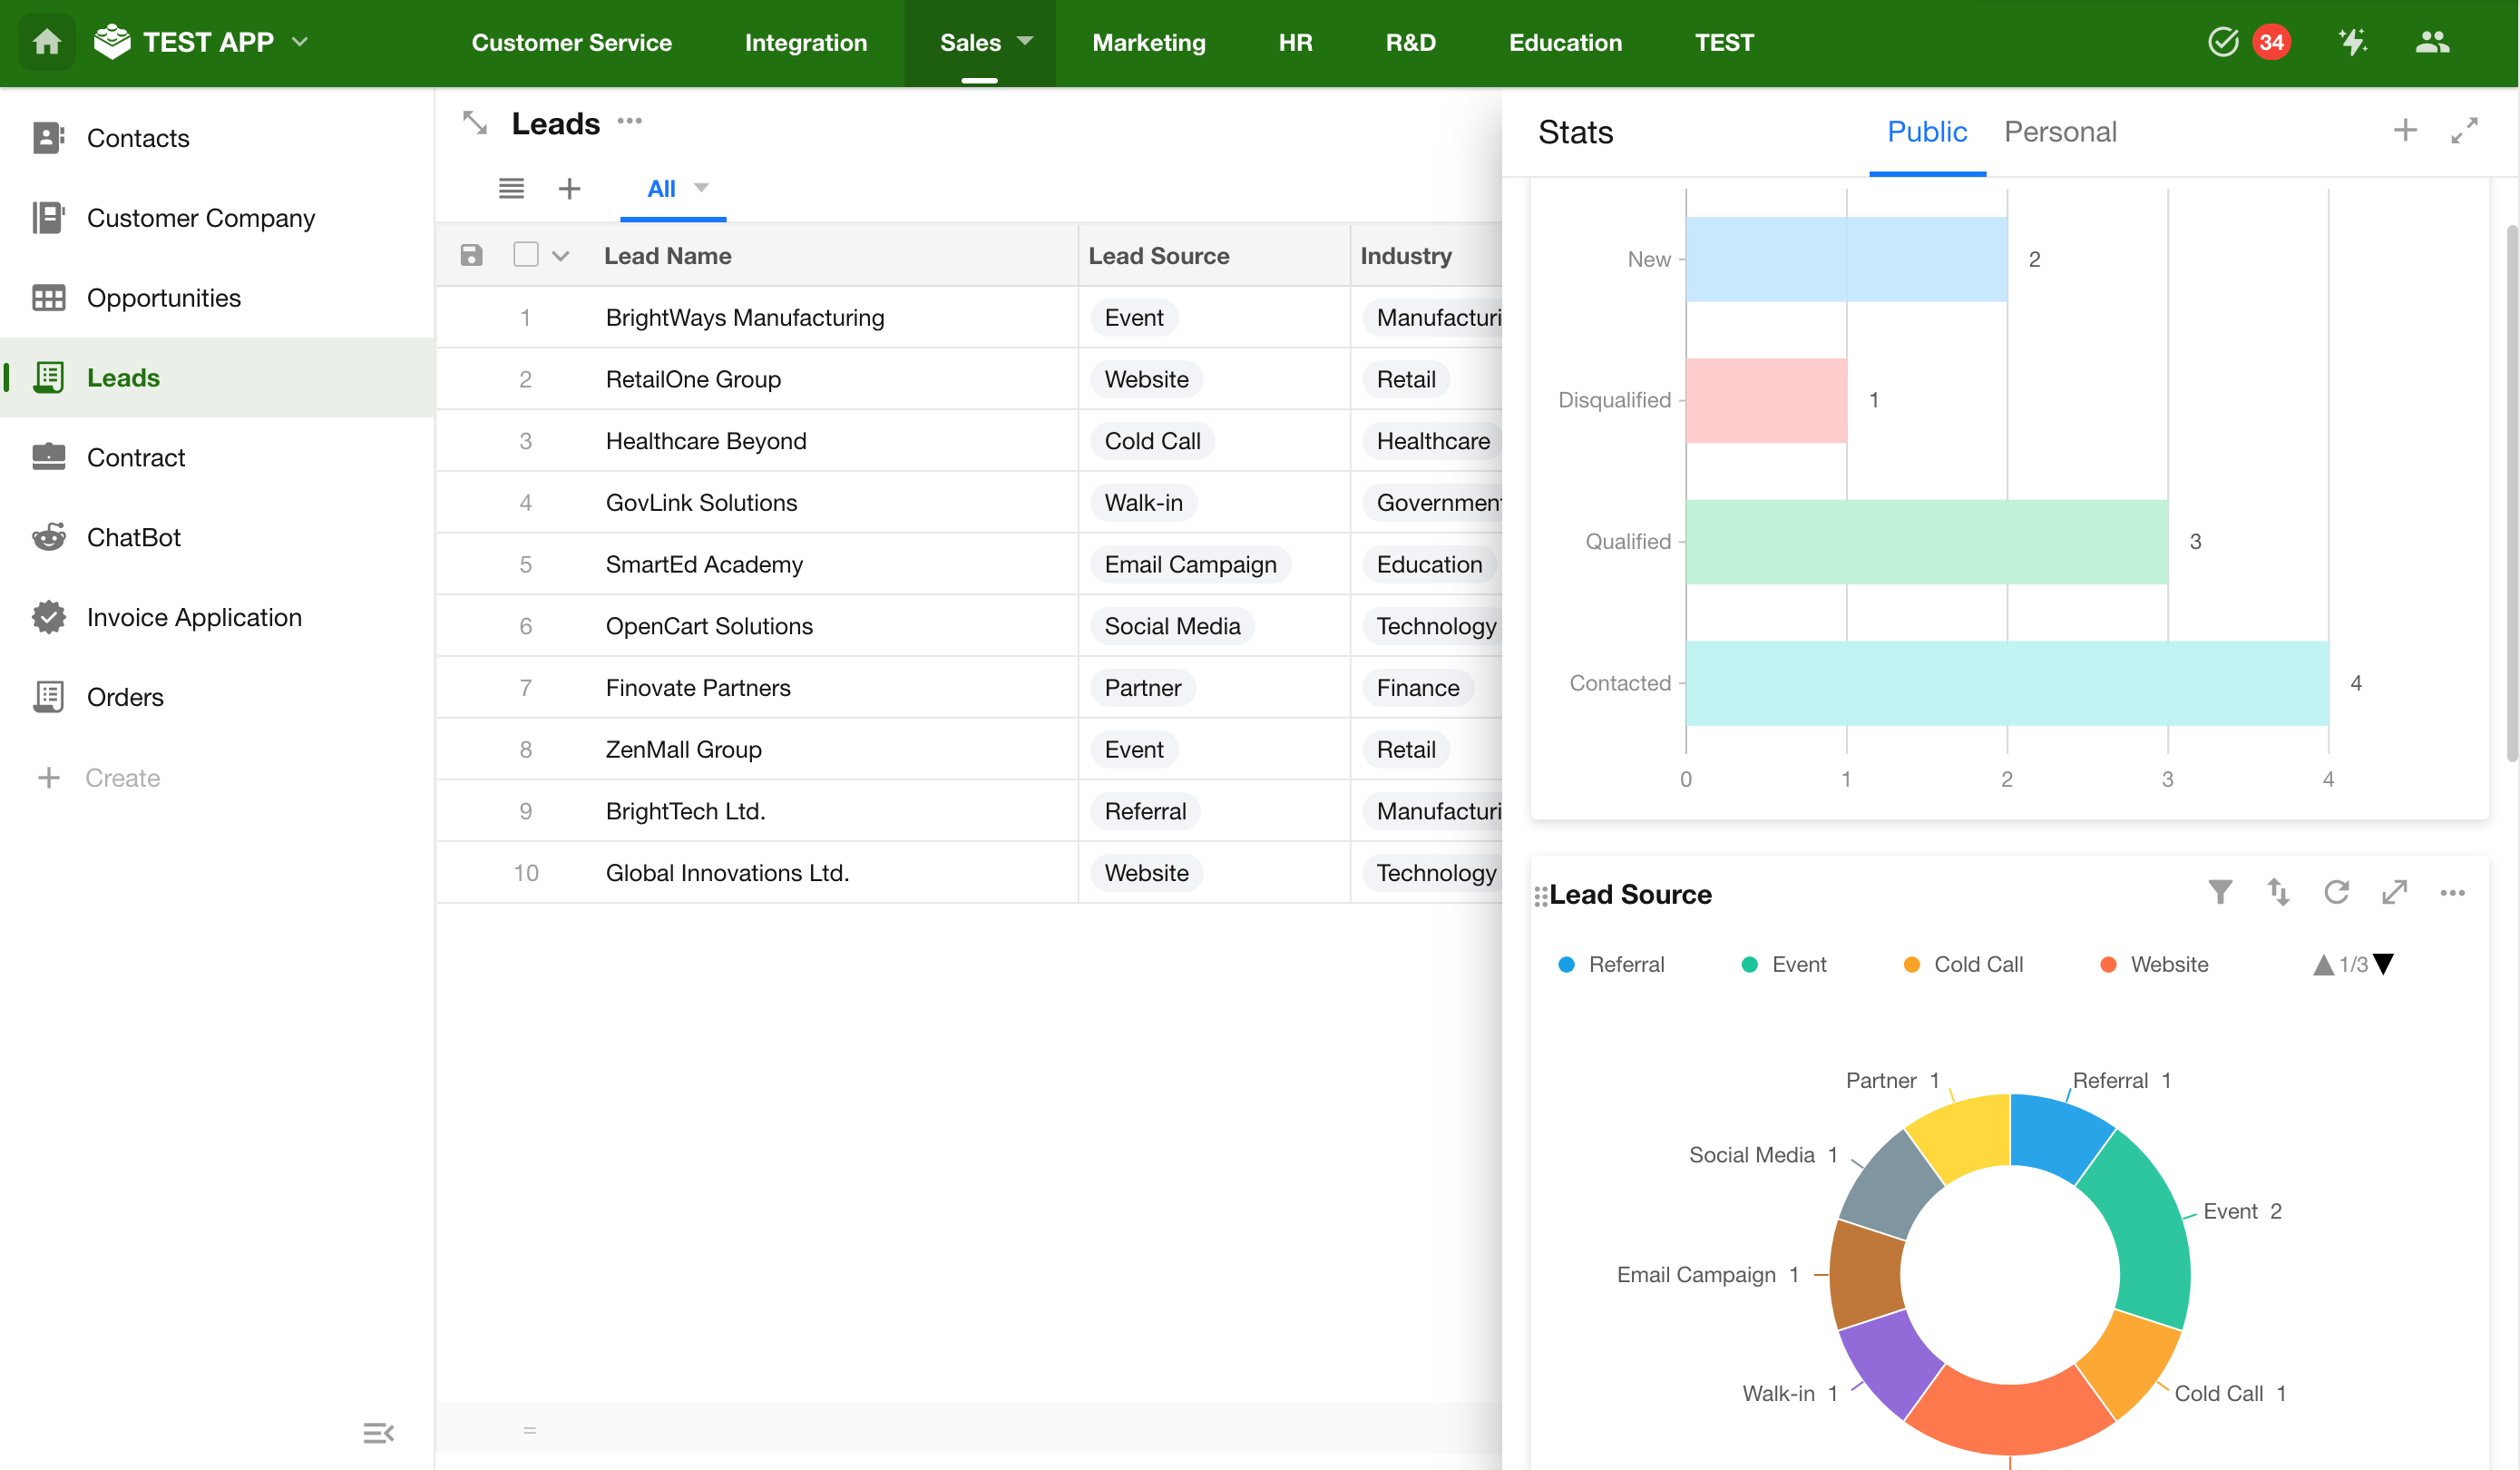
Statistical charts are used to visualize data from a table view, helping users better understand information, identify trends, and perform analysis through graphical representation.
In data analysis, statistical charts are commonly used in the following scenarios:
- Trend analysis: For example, monthly sales growth trends or fluctuations in user activity.
- Structural analysis: For example, the sales proportion of different product lines or the composition of customer sources.
- Comparative analysis: For example, performance rankings across regions or employee performance comparisons.
- Conversion analysis: For example, recruitment funnels or sales opportunity conversion rates.
- Target monitoring: For example, tracking the progress of annual sales targets.
Supported Chart Types and Use Cases
HAP supports a wide range of statistical charts. Different chart types are suitable for different data analysis scenarios. You can choose an appropriate chart type based on your analysis objective.
| Chart Type | Applicable Scenario | Example Use Case |
|---|---|---|
| Bar Chart / Horizontal Bar Chart | Compare values across different categories | Analyze monthly sales performance of each sales team in the current year |
| Symmetric Bar Chart | Compare two opposing metrics | Analyze annual store revenue versus refunds |
| Line Chart | View trends in data over time | Display monthly sales changes throughout the year |
| Combination Chart | Display two metrics with different scales simultaneously | Analyze daily new purchase order count and order amount |
| Scatter Chart | Observe relationships or correlations between two variables | Visualize population migration distribution across cities |
| Radar Chart | Perform multi-dimensional comparison of metrics | Analyze purchase order sources and order amounts |
| Pie Chart | View the proportional structure of overall data | Analyze salary cost distribution by department |
| Funnel Chart | Analyze conversion performance in business processes | Display the conversion process from sales leads to closed deals |
| Word Cloud | Display the frequency of text keywords | Analyze the most popular professional keywords |
| Number Chart | Display key metric values | Analyze the number of new user feedback entries this week |
| Dashboard | Monitor metric status or completion level | Monitor monthly product sales refund amounts |
| Progress Bar | Display target completion progress | Display annual sales target completion rate |
| Ranking List | Display ranked data distribution | Individual sales performance ranking |
| World Map / Administrative Divisions | Display data distribution across geographic regions | Display product sales distribution by region |
| Pivot Table | Perform multi-dimensional data aggregation analysis | Summarize sales data by month, quarter, or year |
How to Choose the Right Statistical Chart?
Before selecting a statistical chart, first clarify your data analysis objective. Different analysis goals require different chart types.
Before configuring a chart, ask yourself:
“What insight do I want readers to gain from this chart?”
Based on analysis intent, common data analysis needs can generally be categorized into the following five types.
1. Comparison: Highlight Differences Across Categories
If you need to compare values across different items (such as products, departments, or employees), consider the following charts:
-
Short category names with a small number of categories (<10)
→ Bar Chart: Provides the most intuitive visual comparison through height differences. -
Long category names or a large number of categories
→ Horizontal Bar Chart: Prevents label overlap and is more suitable for viewing rankings. -
Only need to highlight top performers (Top N)
→ Ranking List: Automatically focuses on leading data points. -
Need to compare two opposing metrics (such as revenue vs. expenses)
→ Symmetric Bar Chart: Displays metrics back-to-back for clearer comparison.
2. Trend Analysis: Understand Changes Over Time
If you need to observe how data changes over continuous time periods (year, month, week, or day), use:
-
Track growth or decline trends
→ Line Chart: Clearly reflects trends through changes in the line. -
Compare two metrics simultaneously (such as order volume vs. order amount)
→ Combination Chart: Uses two axes to address differences in scale.
3. Proportion Analysis: Understand Overall Composition
If you need to show how each part contributes to the whole (usually totaling 100%), use:
-
Small number of categories (typically <6)
→ Pie Chart: The most intuitive way to present proportions. -
Evaluate overall performance across multiple dimensions
→ Radar Chart: Suitable for capability assessment or multi-metric comparison. -
Analyze the popularity or weight of text data
→ Word Cloud: Automatically adjusts font size based on keyword frequency.
Note: When there are many categories, it is not recommended to use a pie chart. Consider using a Bar Chart combined with percentage labels instead.
4. Business-Specific Analysis: Gain Deeper Insights
If the analysis involves clear business logic or spatial dimensions, consider the following charts:
-
Analyze conversion rates within business processes
→ Funnel Chart: Commonly used in sales funnels or recruitment process analysis. -
View business distribution across geographic regions
→ World Map / Administrative Divisions: Highlights regional differences using bubbles or color intensity. -
Analyze the correlation between two metrics
→ Scatter Chart: Helps determine whether a relationship exists between variables.
5. Key Metrics: Quickly View Critical Results
If complex analysis is not required and you only need a quick view of key indicators, use:
-
View current key values (such as today’s sales)
→ Number Chart: Ideal for displaying critical metrics on dashboards. -
Track target completion or current progress
→ Dashboard / Progress Bar: Visual scales clearly indicate completion status. -
Perform multi-dimensional data aggregation analysis
→ Pivot Table: Supports cross-tabulation analysis similar to Excel.
Was this document helpful?