Word Cloud
A word cloud visualizes a collection of words in a cloud-like graphical format, often used to display the frequency or prominence of keywords within large volumes of text data.
Below is an example of how to create a word cloud chart.
Example: Generate a word cloud to analyze the most popular majors this year in the Academic Statistics worksheet.
Data Scope: Major selections submitted this year
View: "All"
Time: This year
Word Label (Dimension): "Major"
Word Size (Metric): A numeric field in the worksheet (e.g., number of records), which determines the visual size of each word
Chart Configuration
1. Create a New Chart
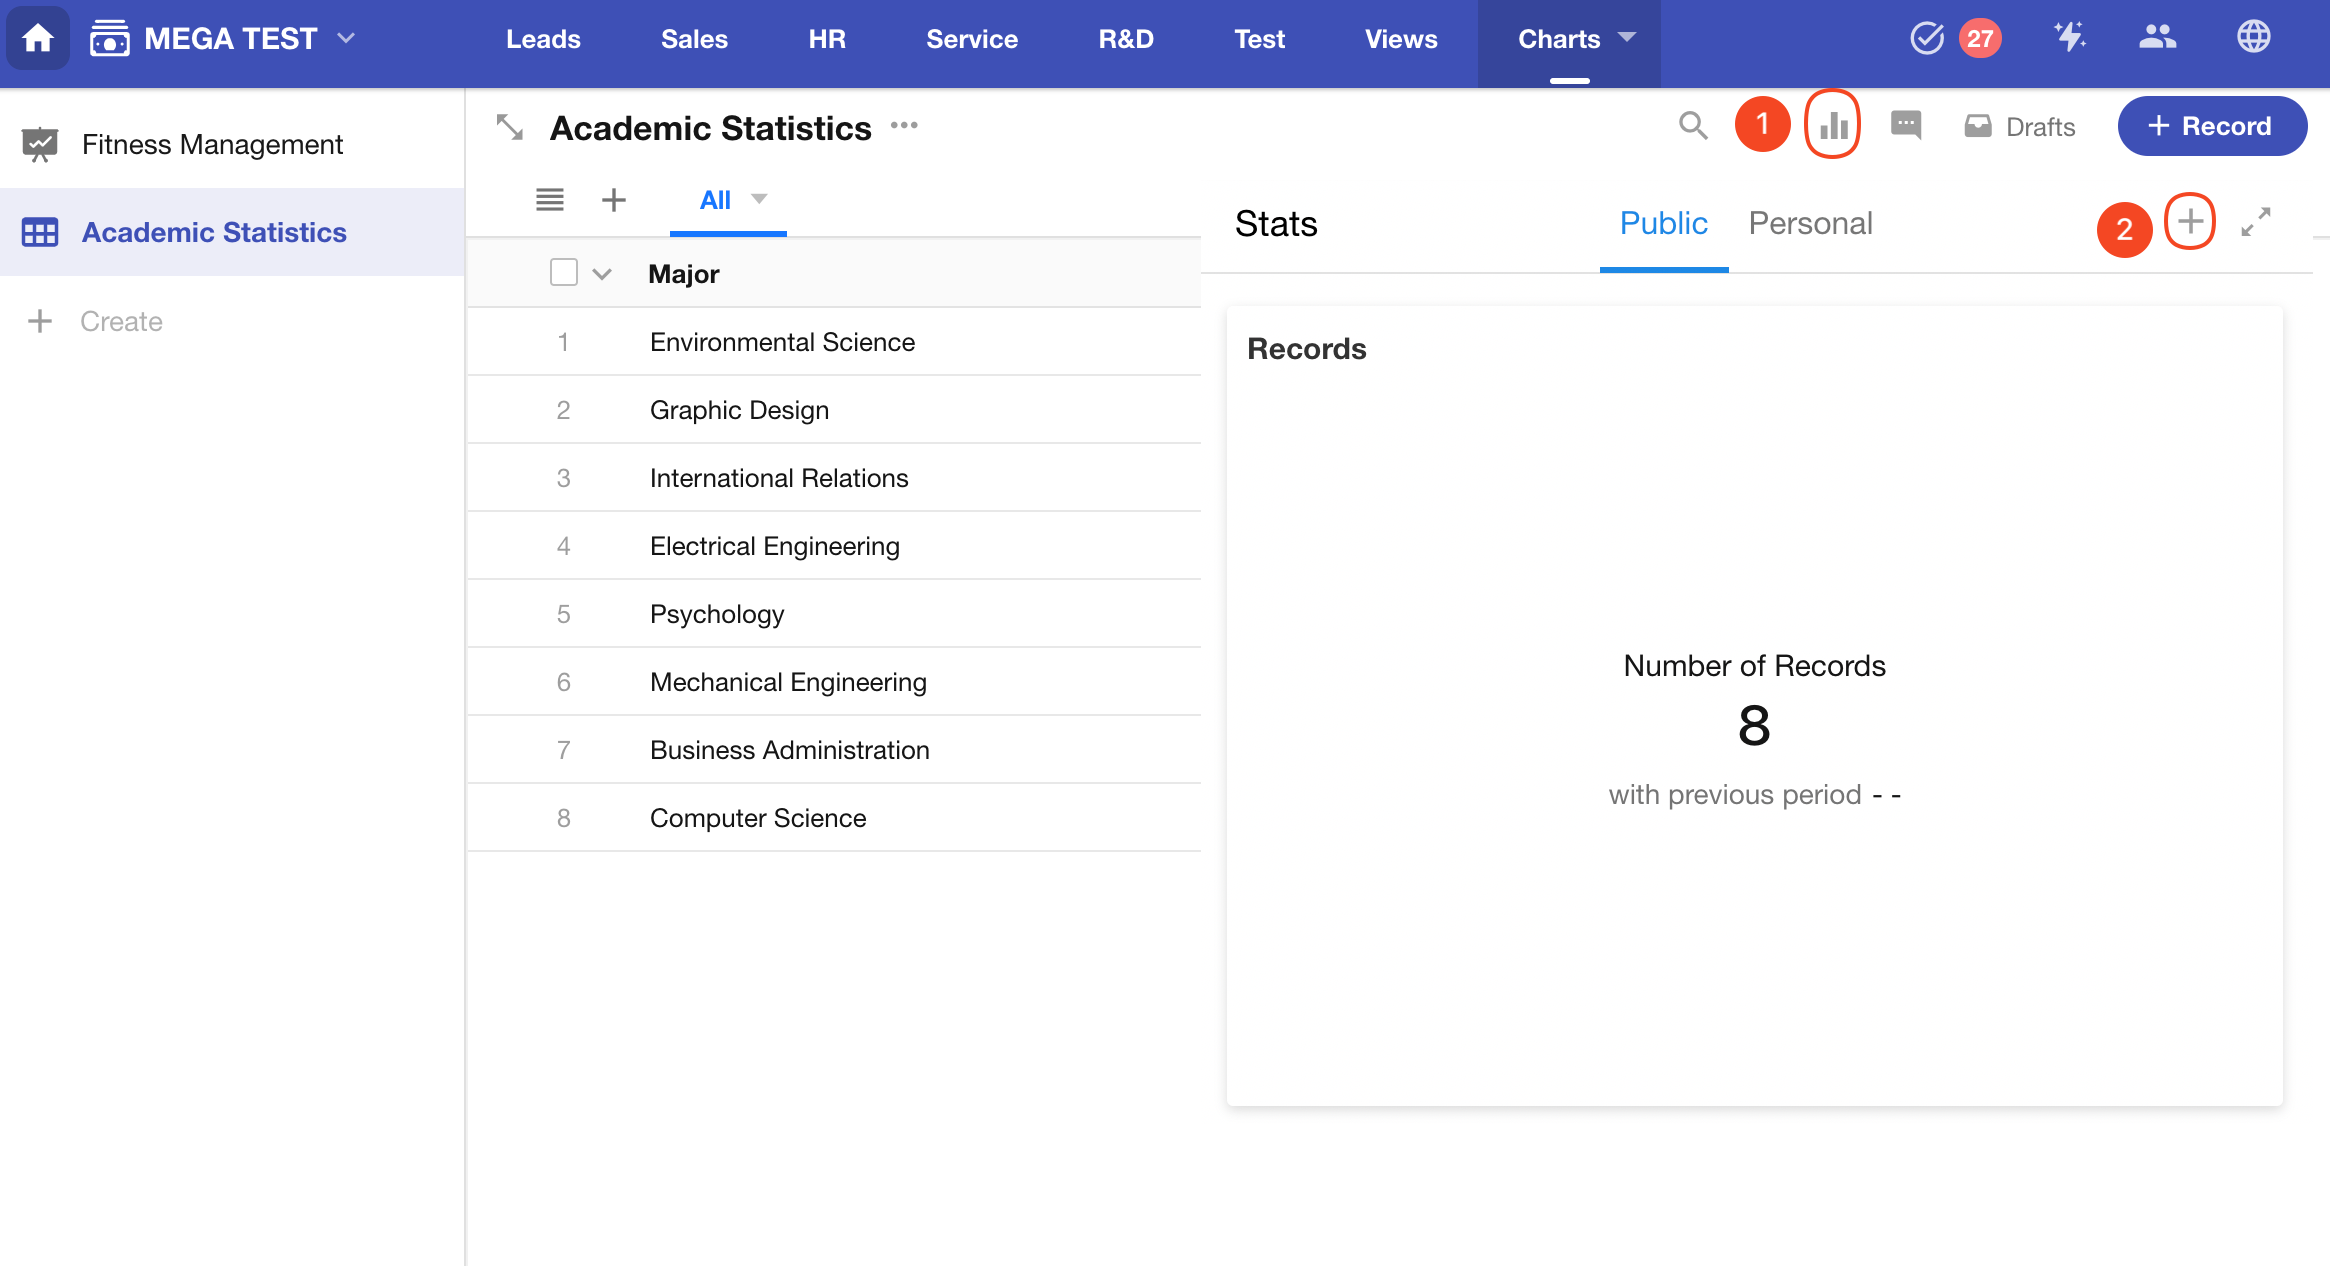
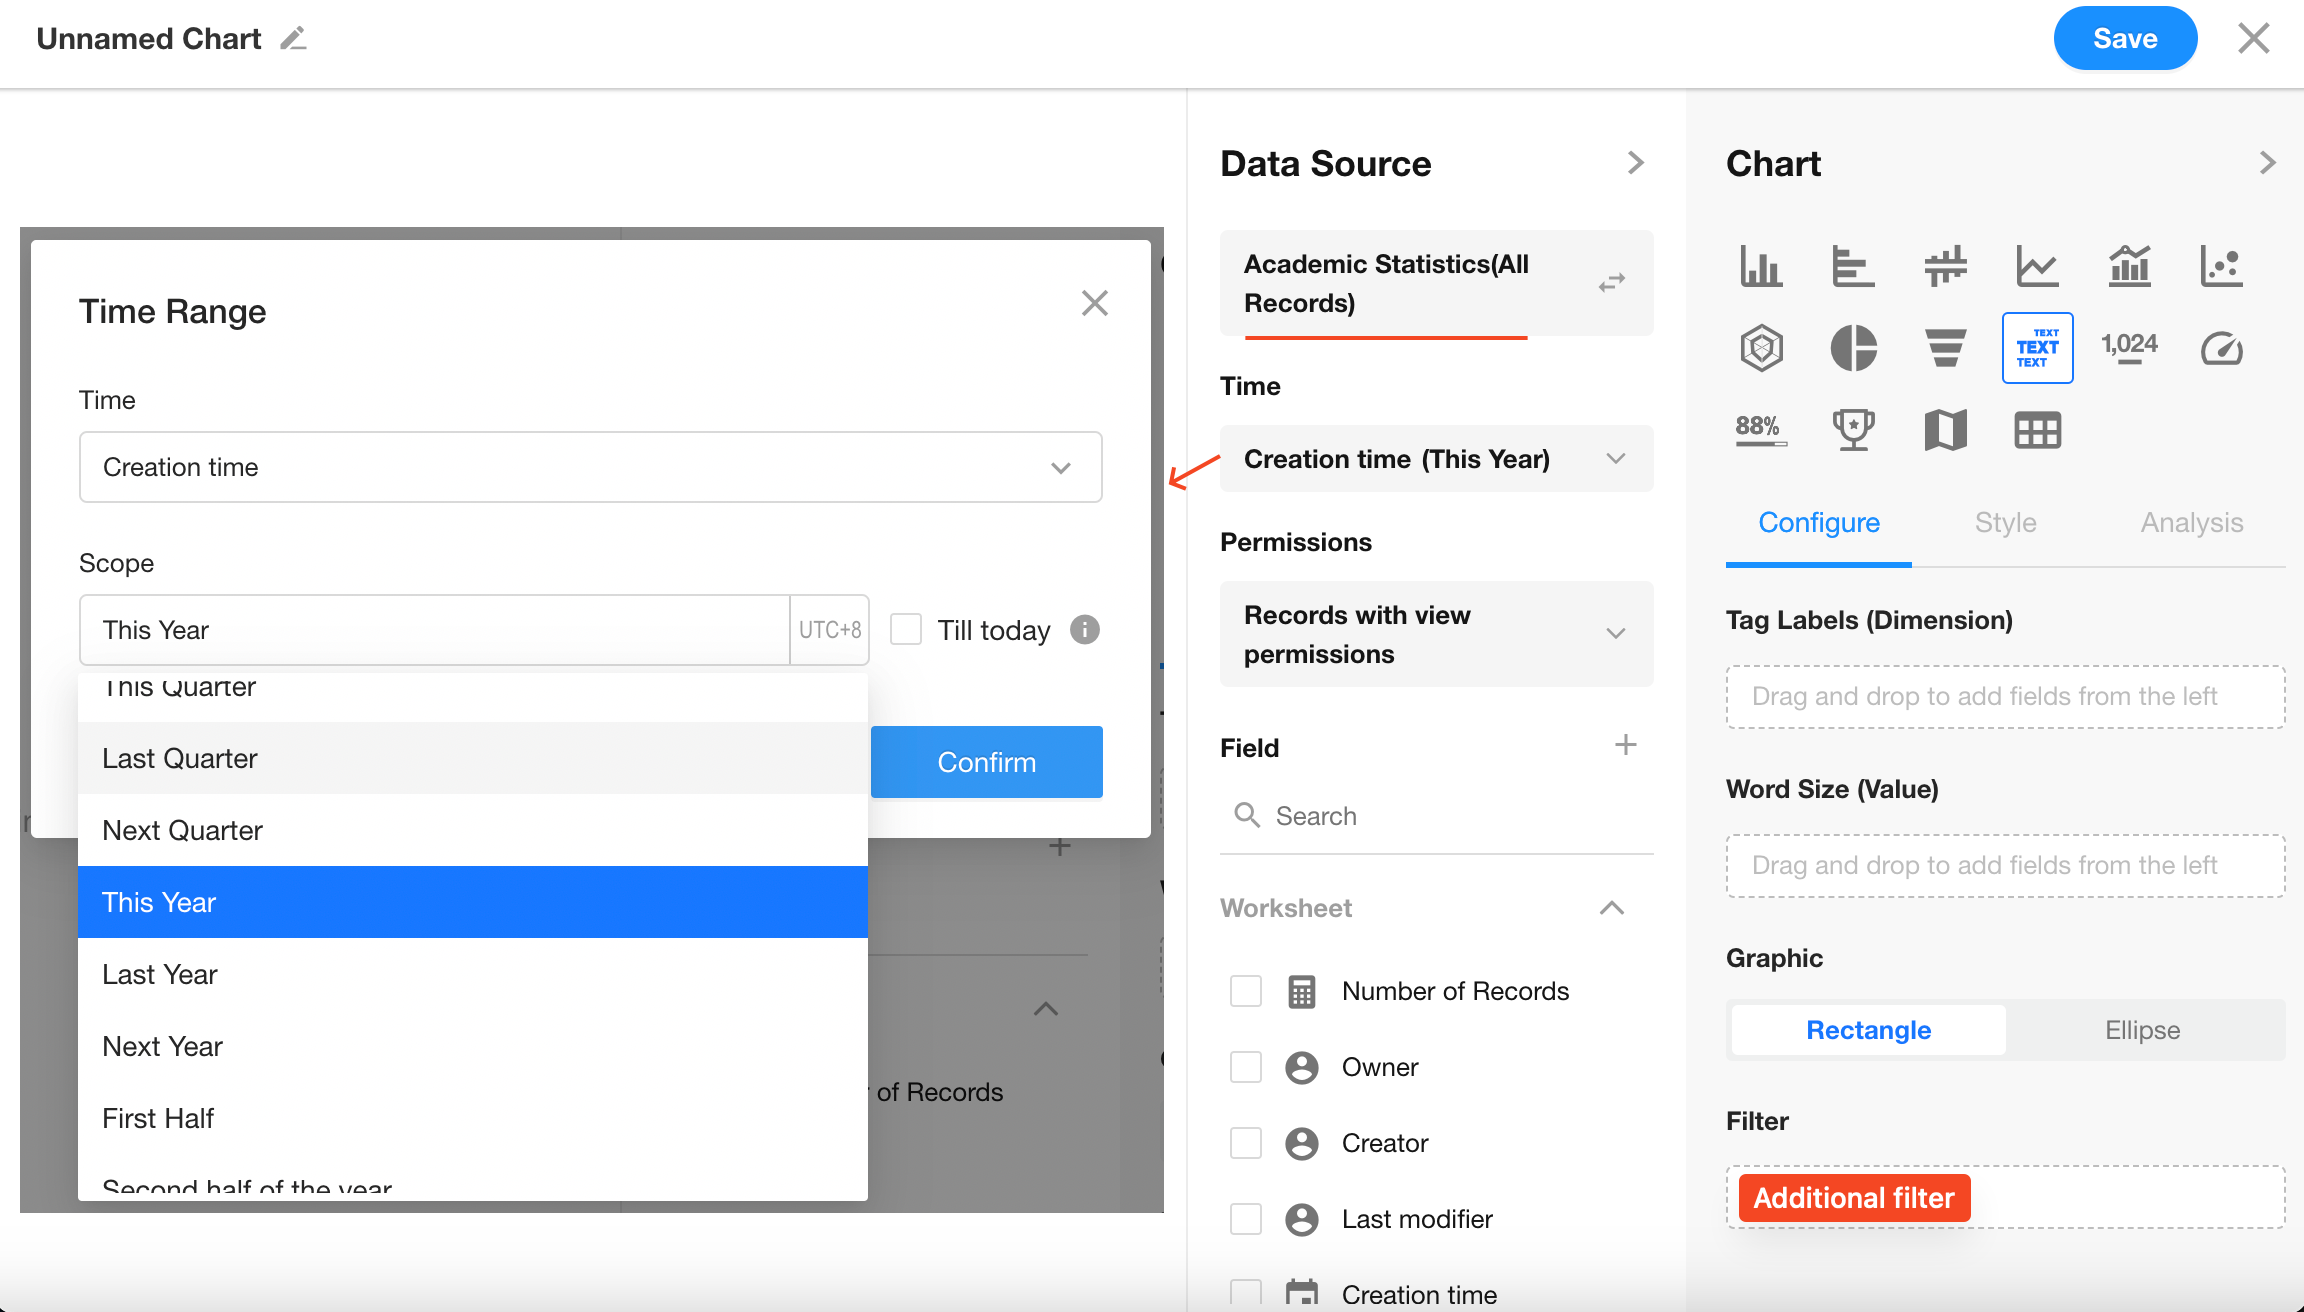
2. Define Record Filter
Filter records in the "Academic Statistics" worksheet where the “Creation Time” is within the current year.
You may also add additional filters if needed.
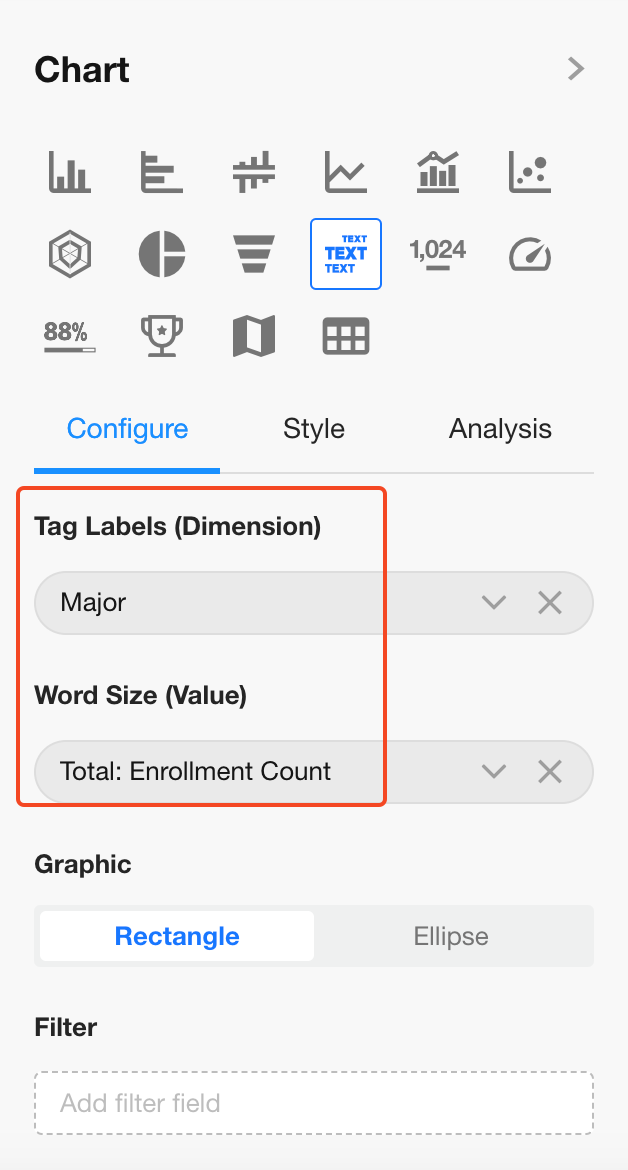
3. Select Chart Type: Word Cloud
Word Label: Select the "Major" field
Word Size: Select the "Number of People" field (aggregated using Sum)
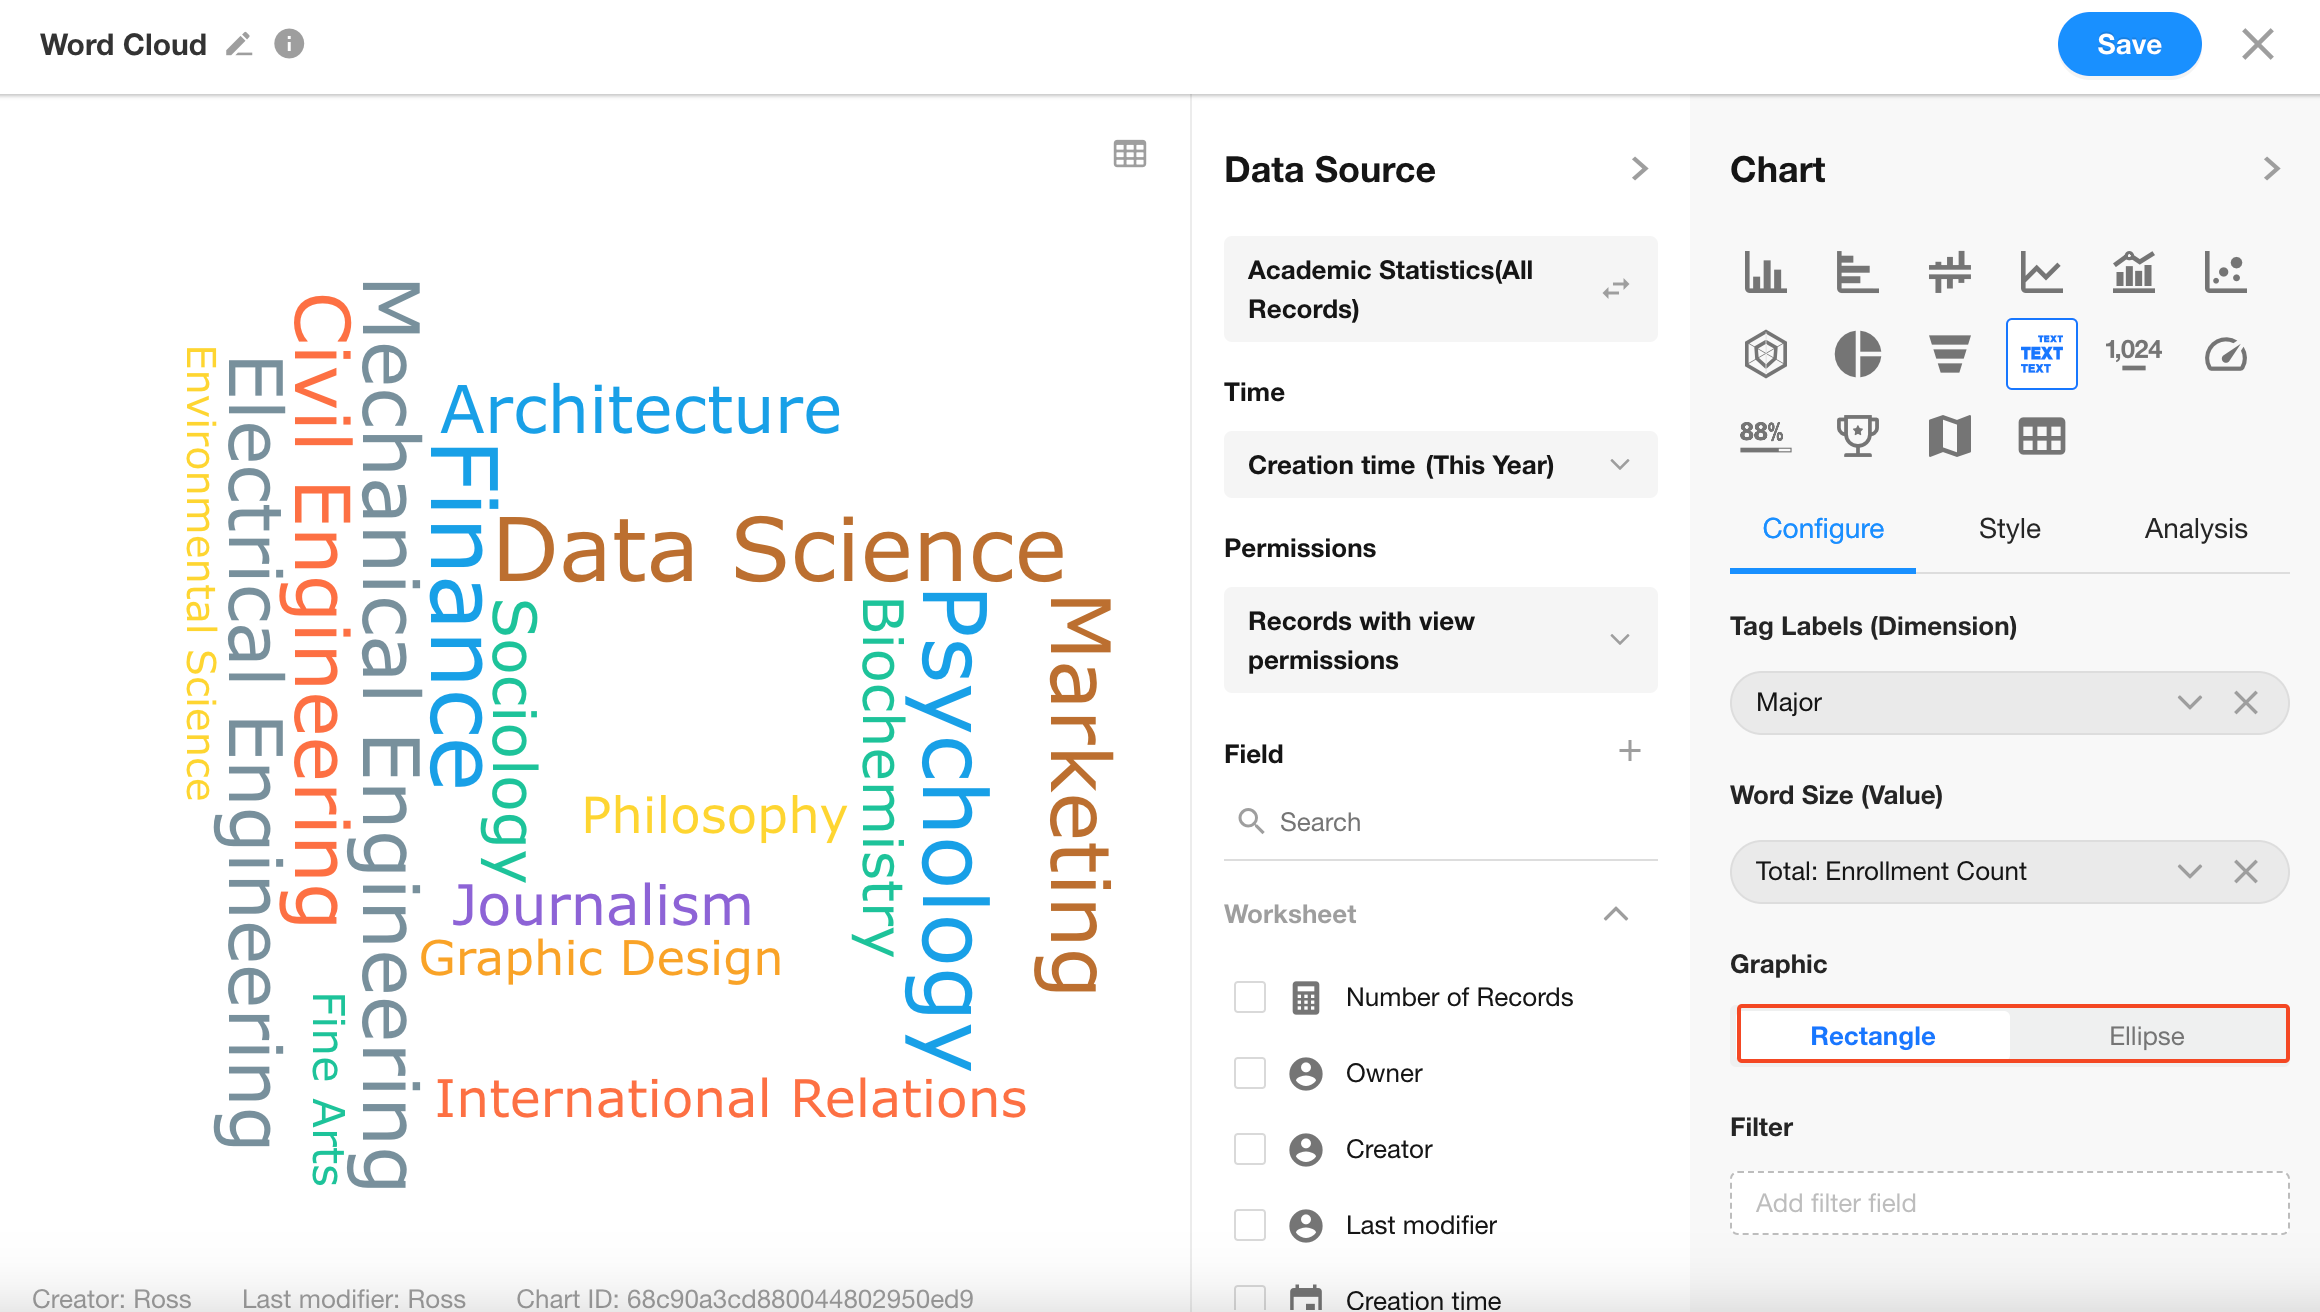
4. Word Cloud Style
You can choose between rectangular or elliptical layout styles.
Click “Save” to complete your chart configuration.
Was this document helpful?