Adding Filters to a Custom Page
Filters allow you to apply secondary filtering to data in charts or views on a custom page. A single filter can be linked to multiple charts or views for unified and flexible data filtering.
Step-by-Step Guide
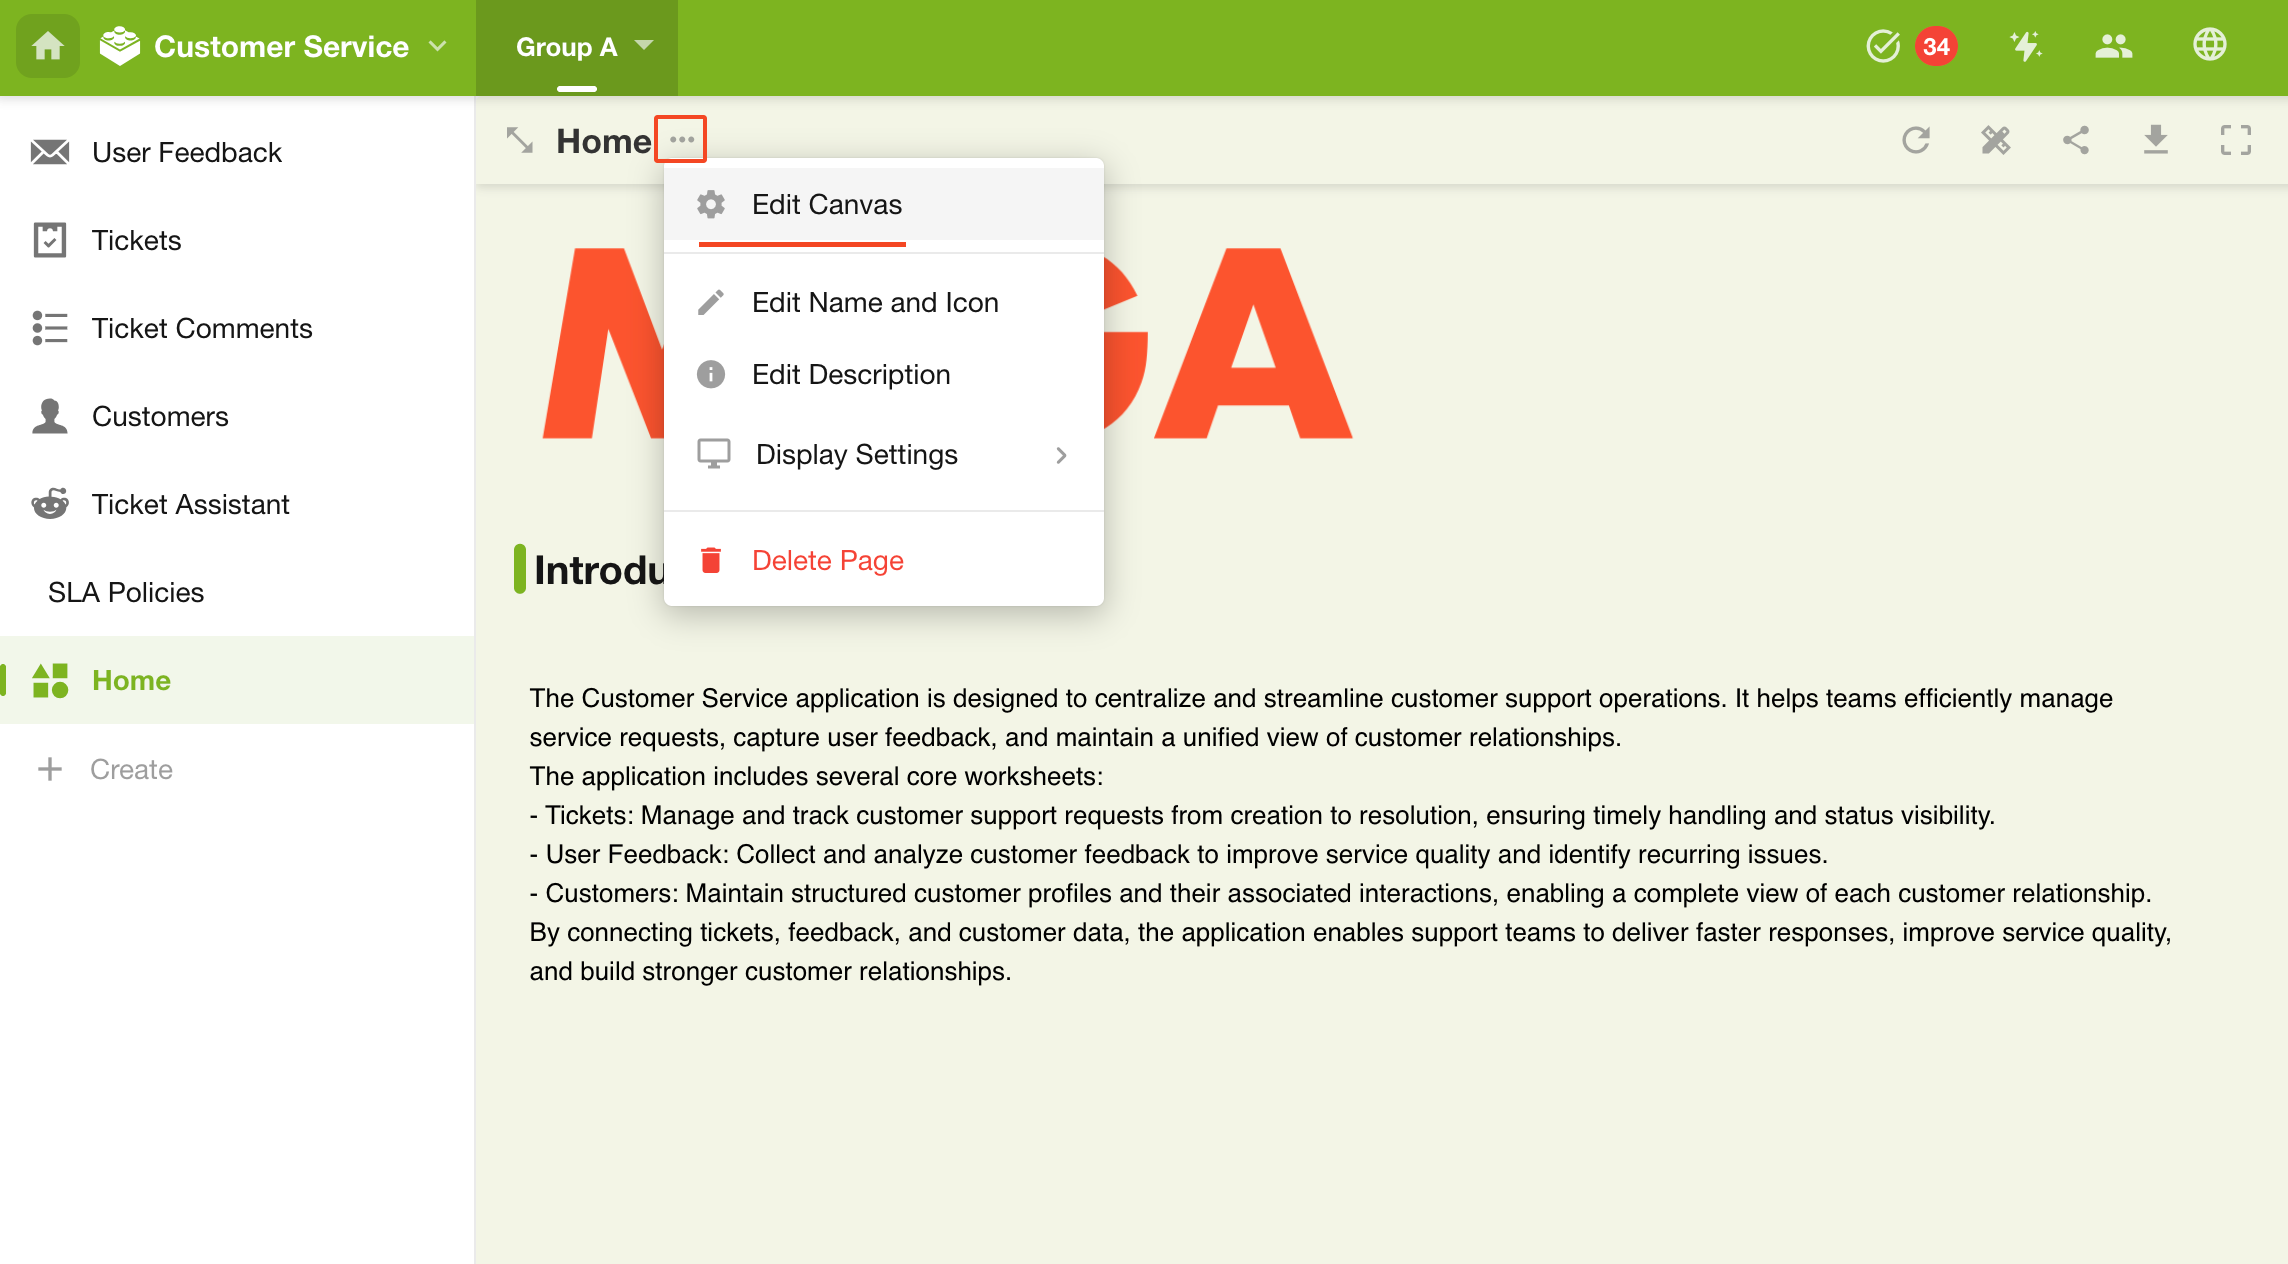
1. Go to the Custom Page Editing Interface
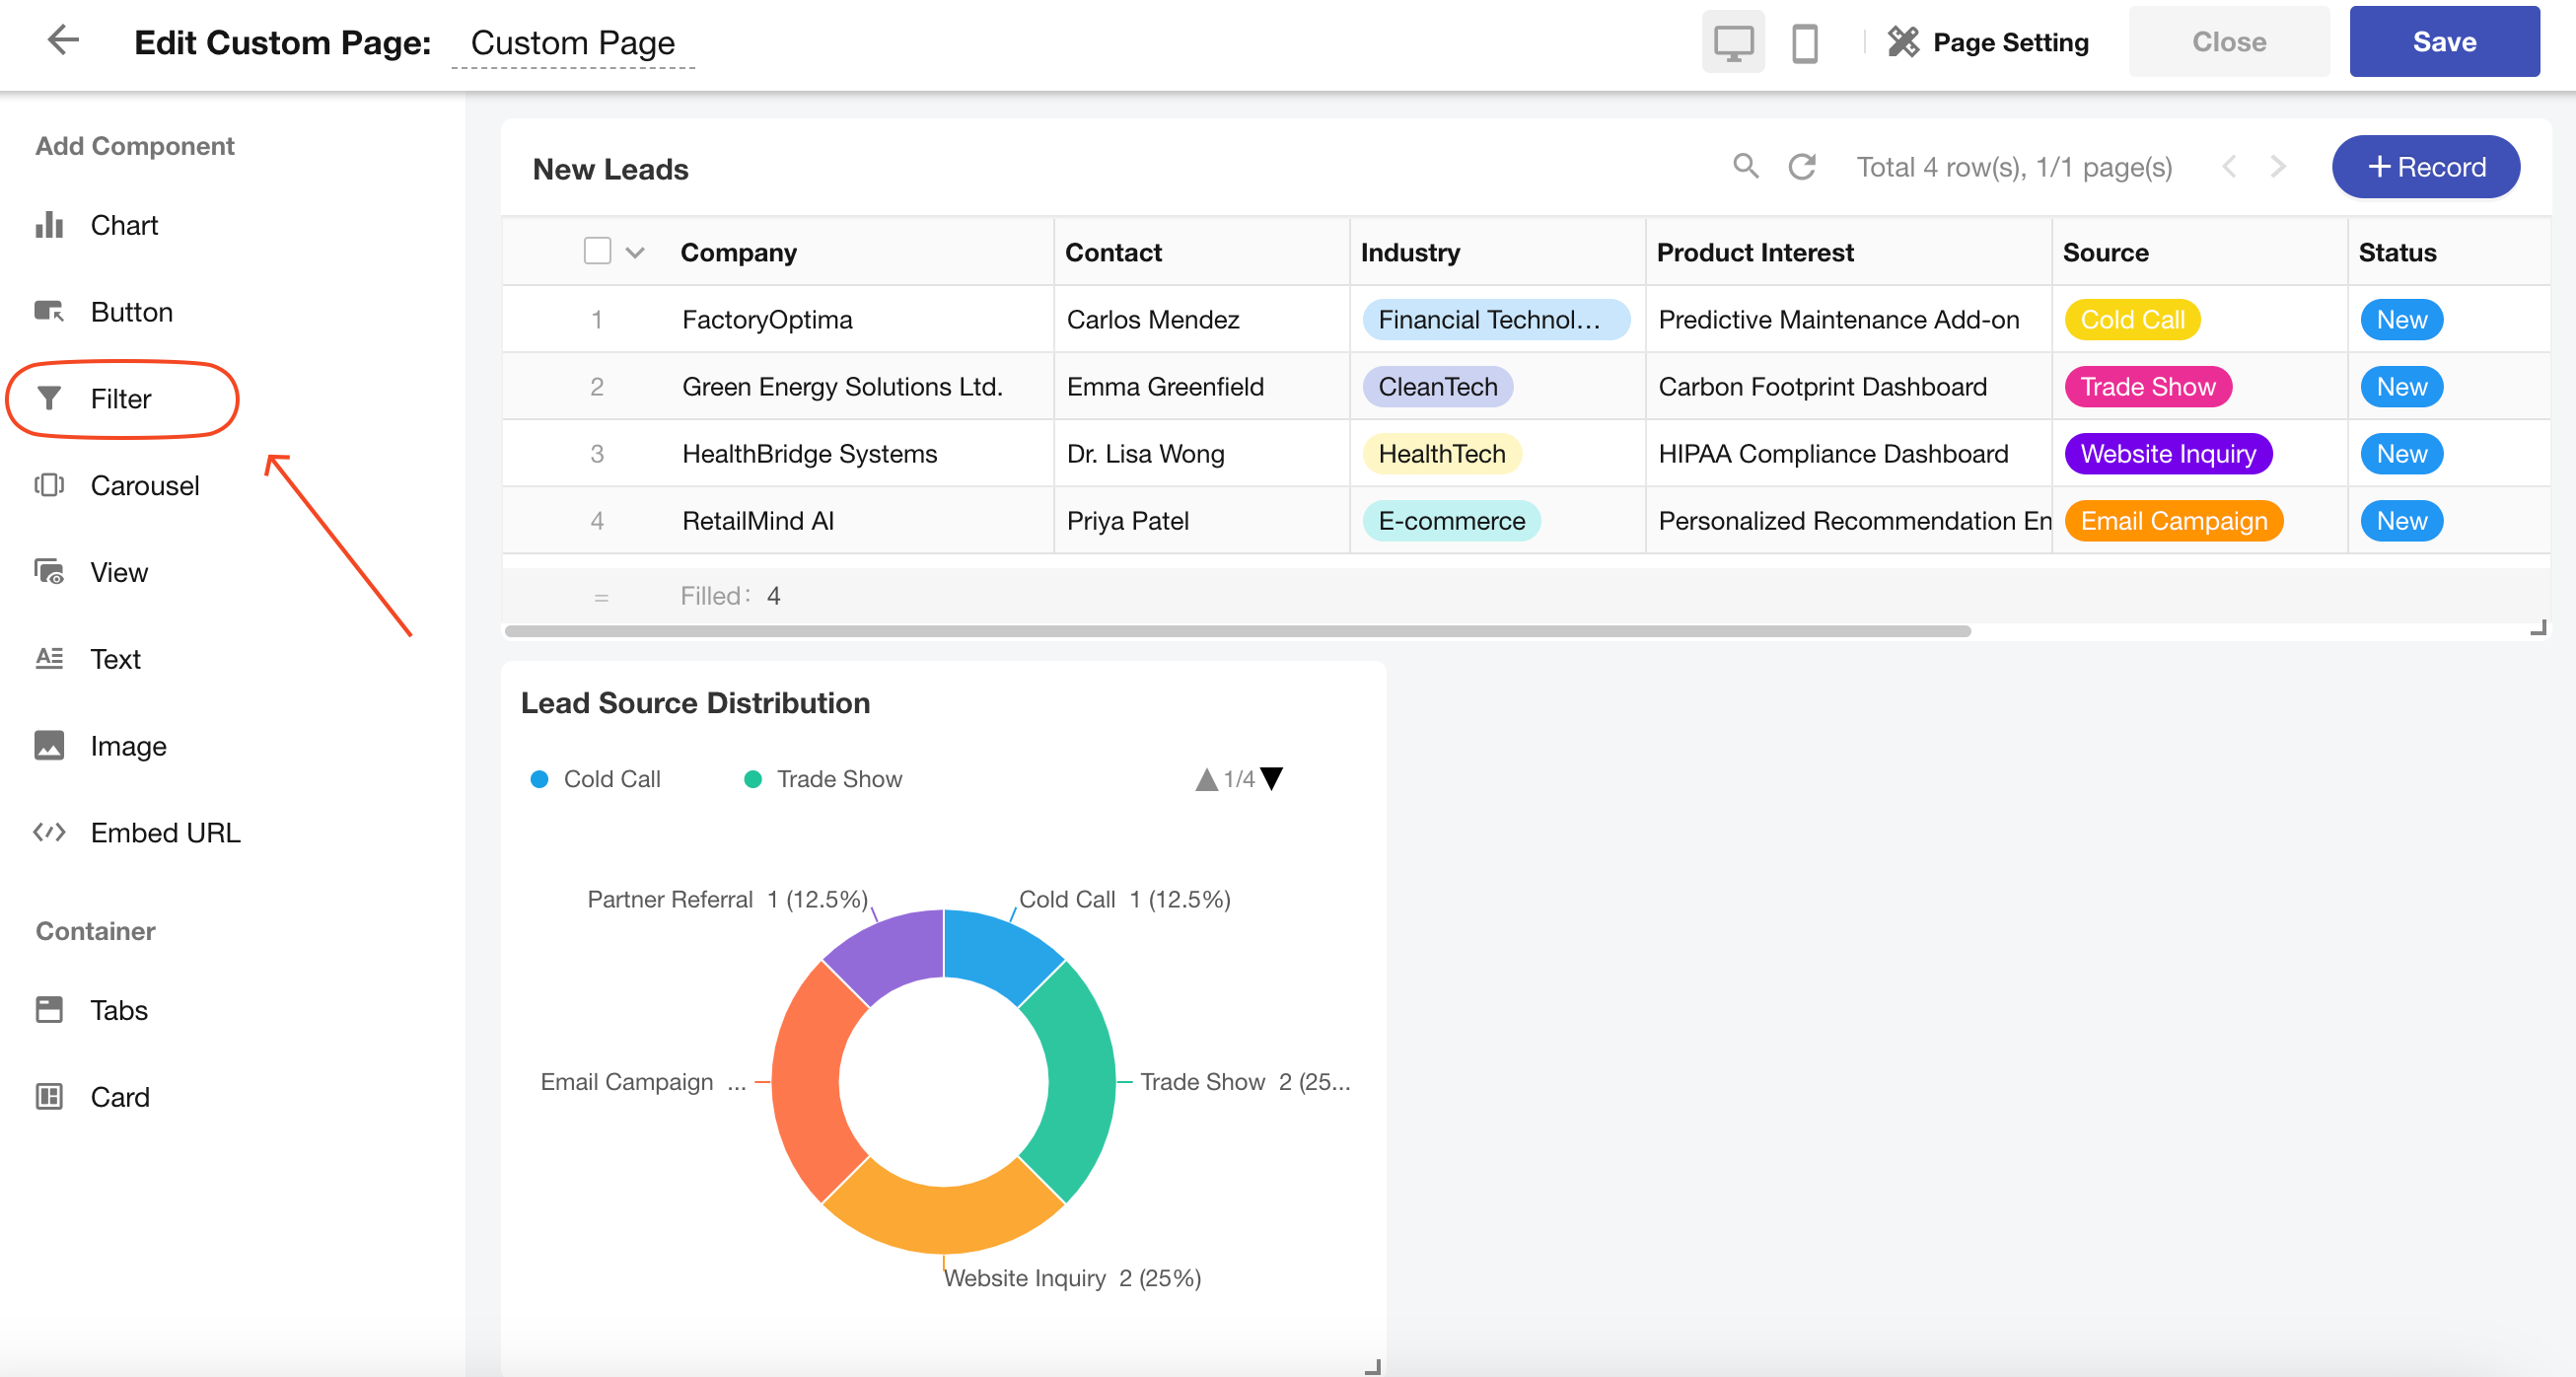
2. Add a Filter Component
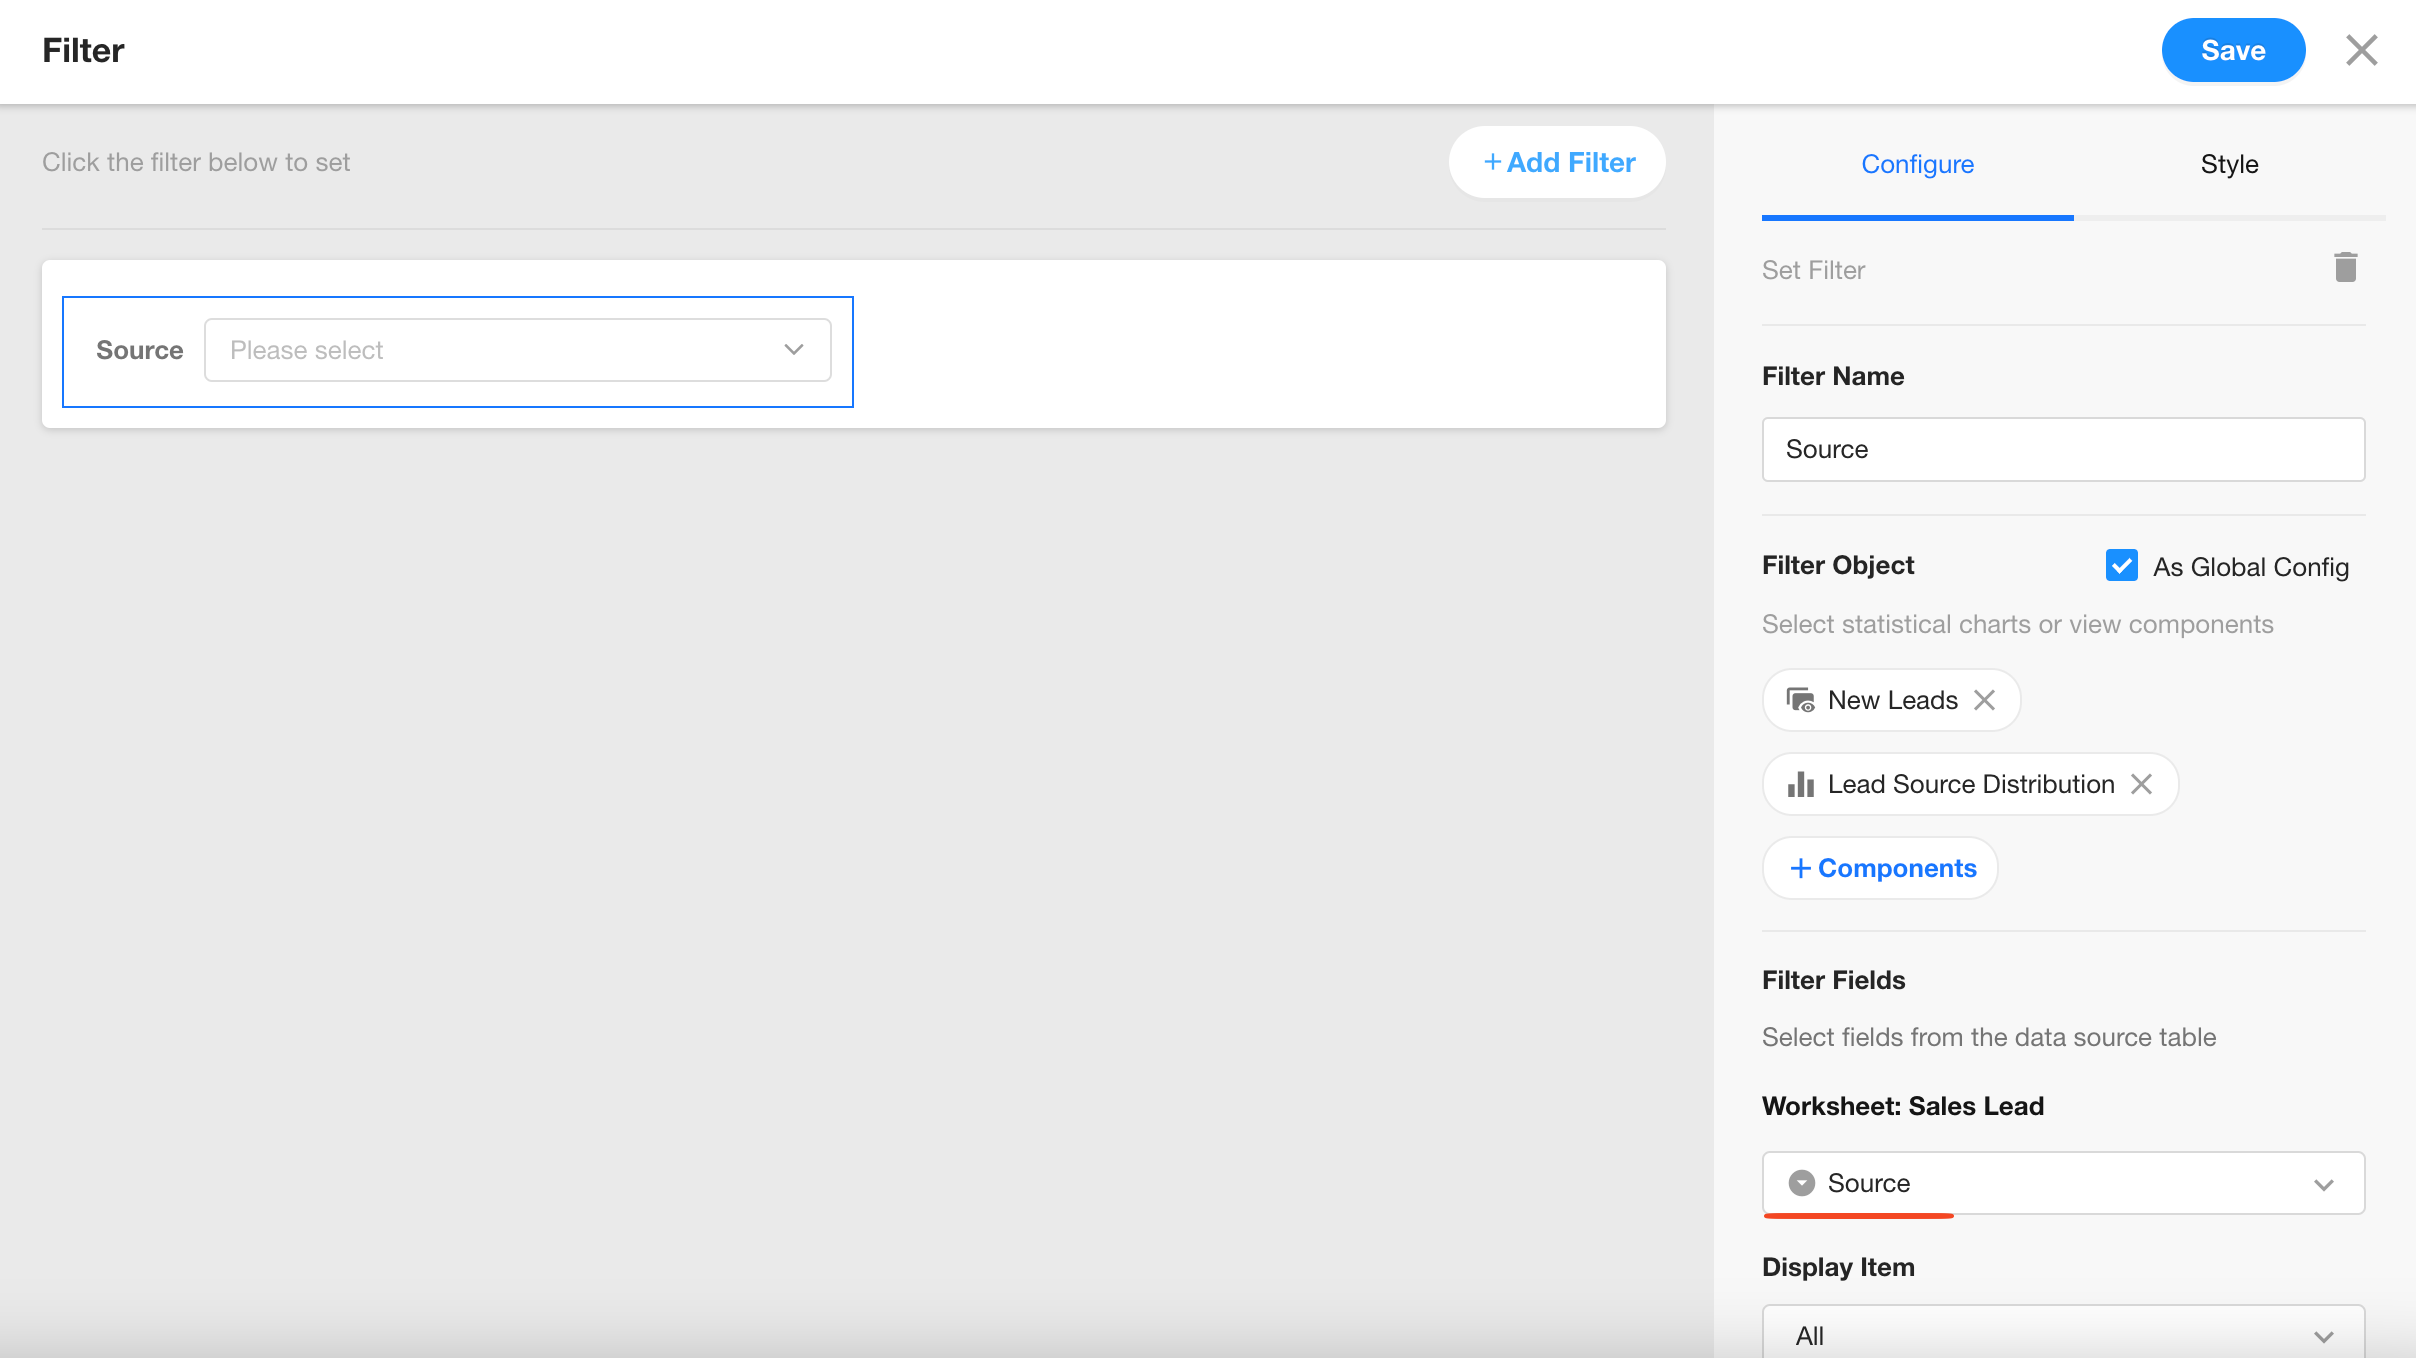
3. Select the Charts or Views to Filter
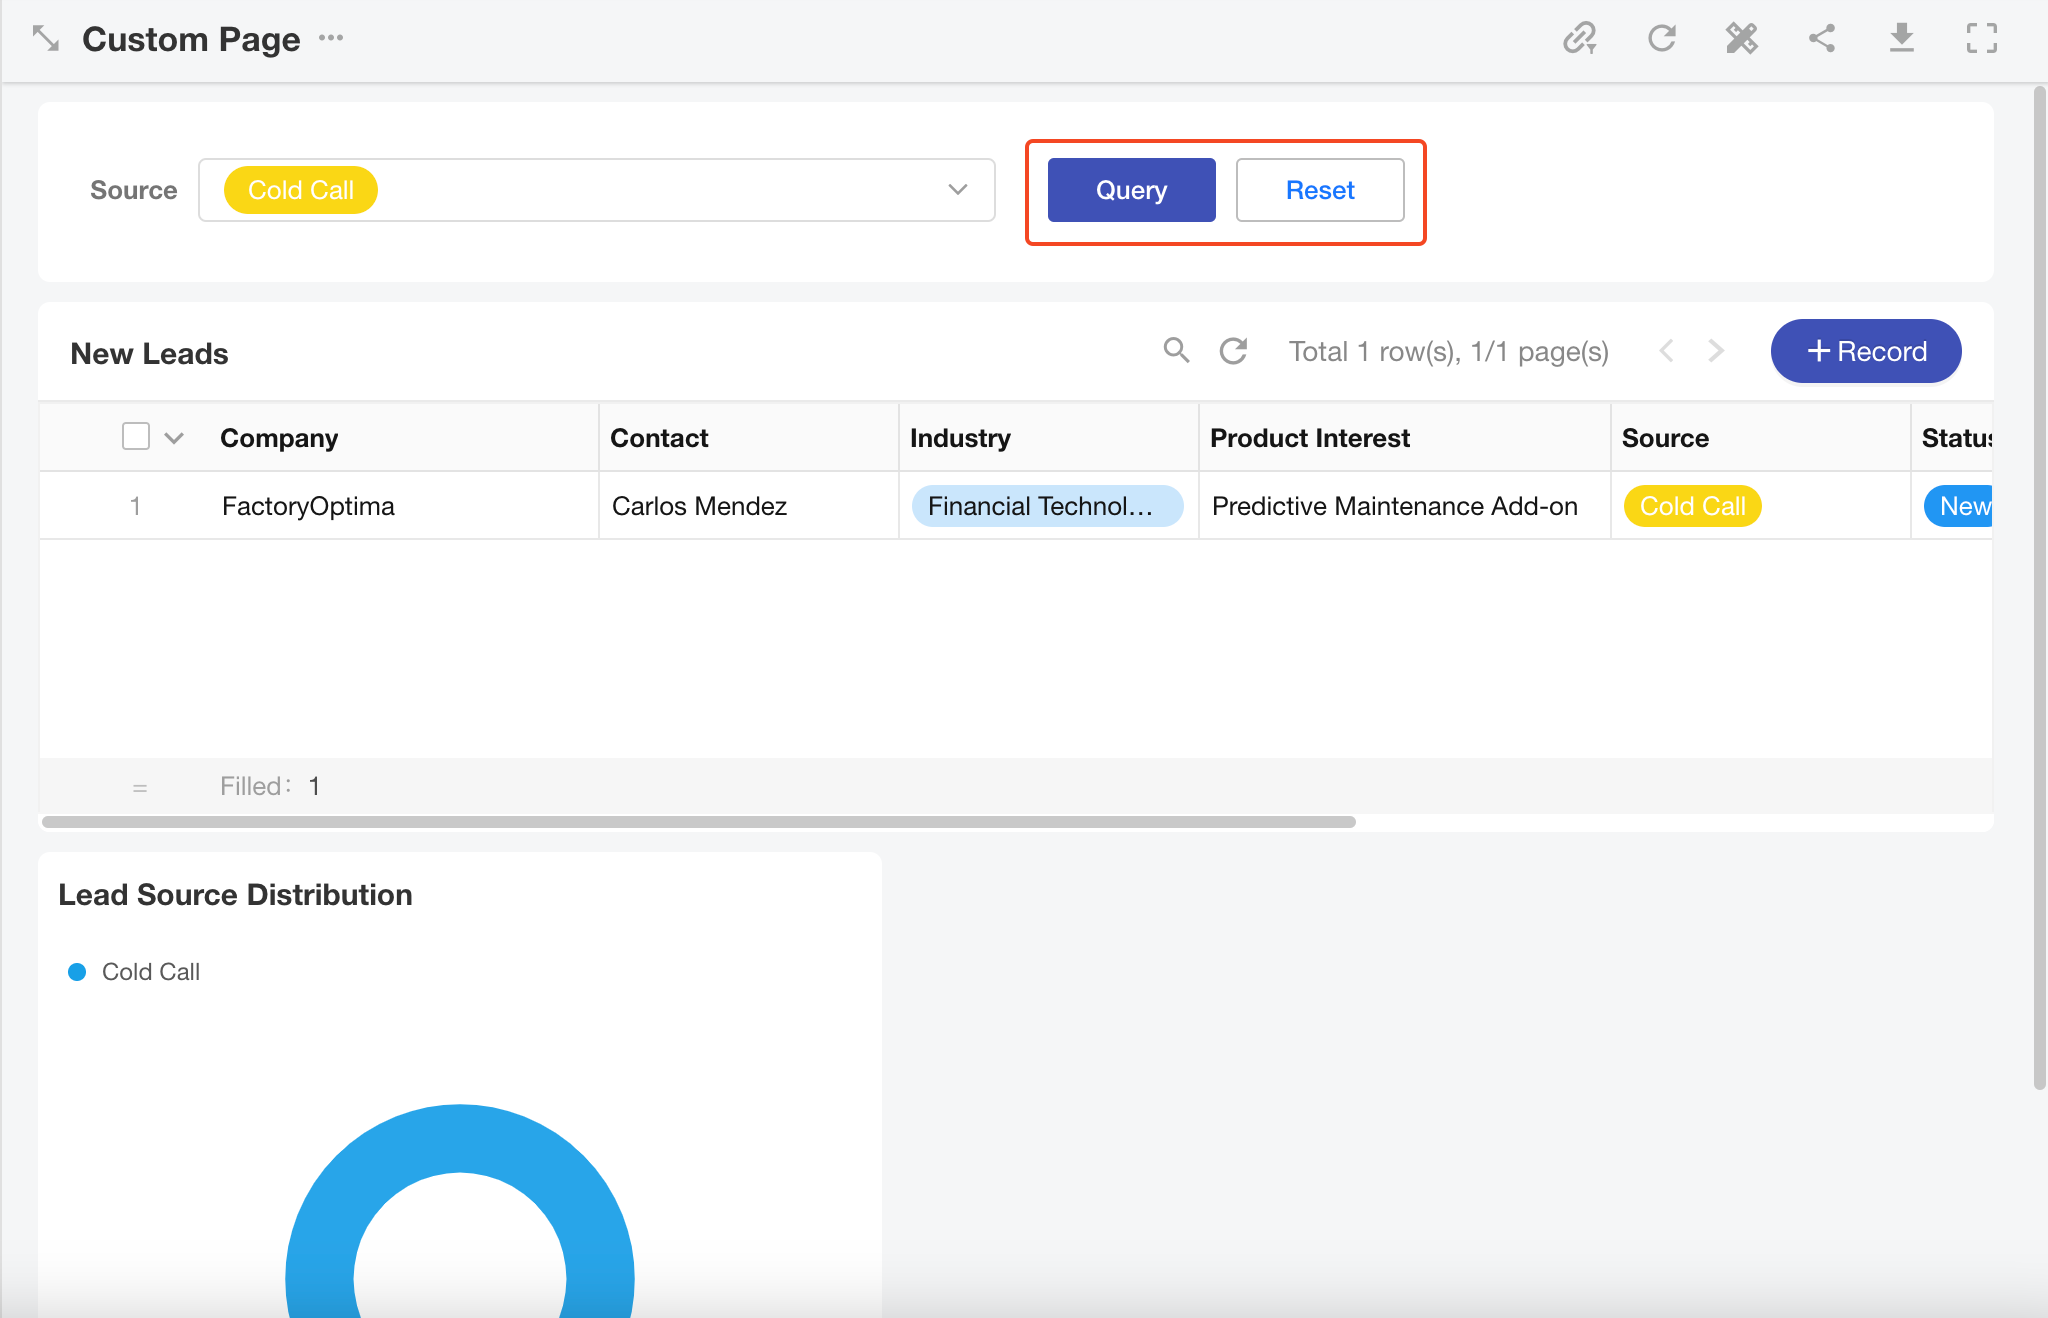
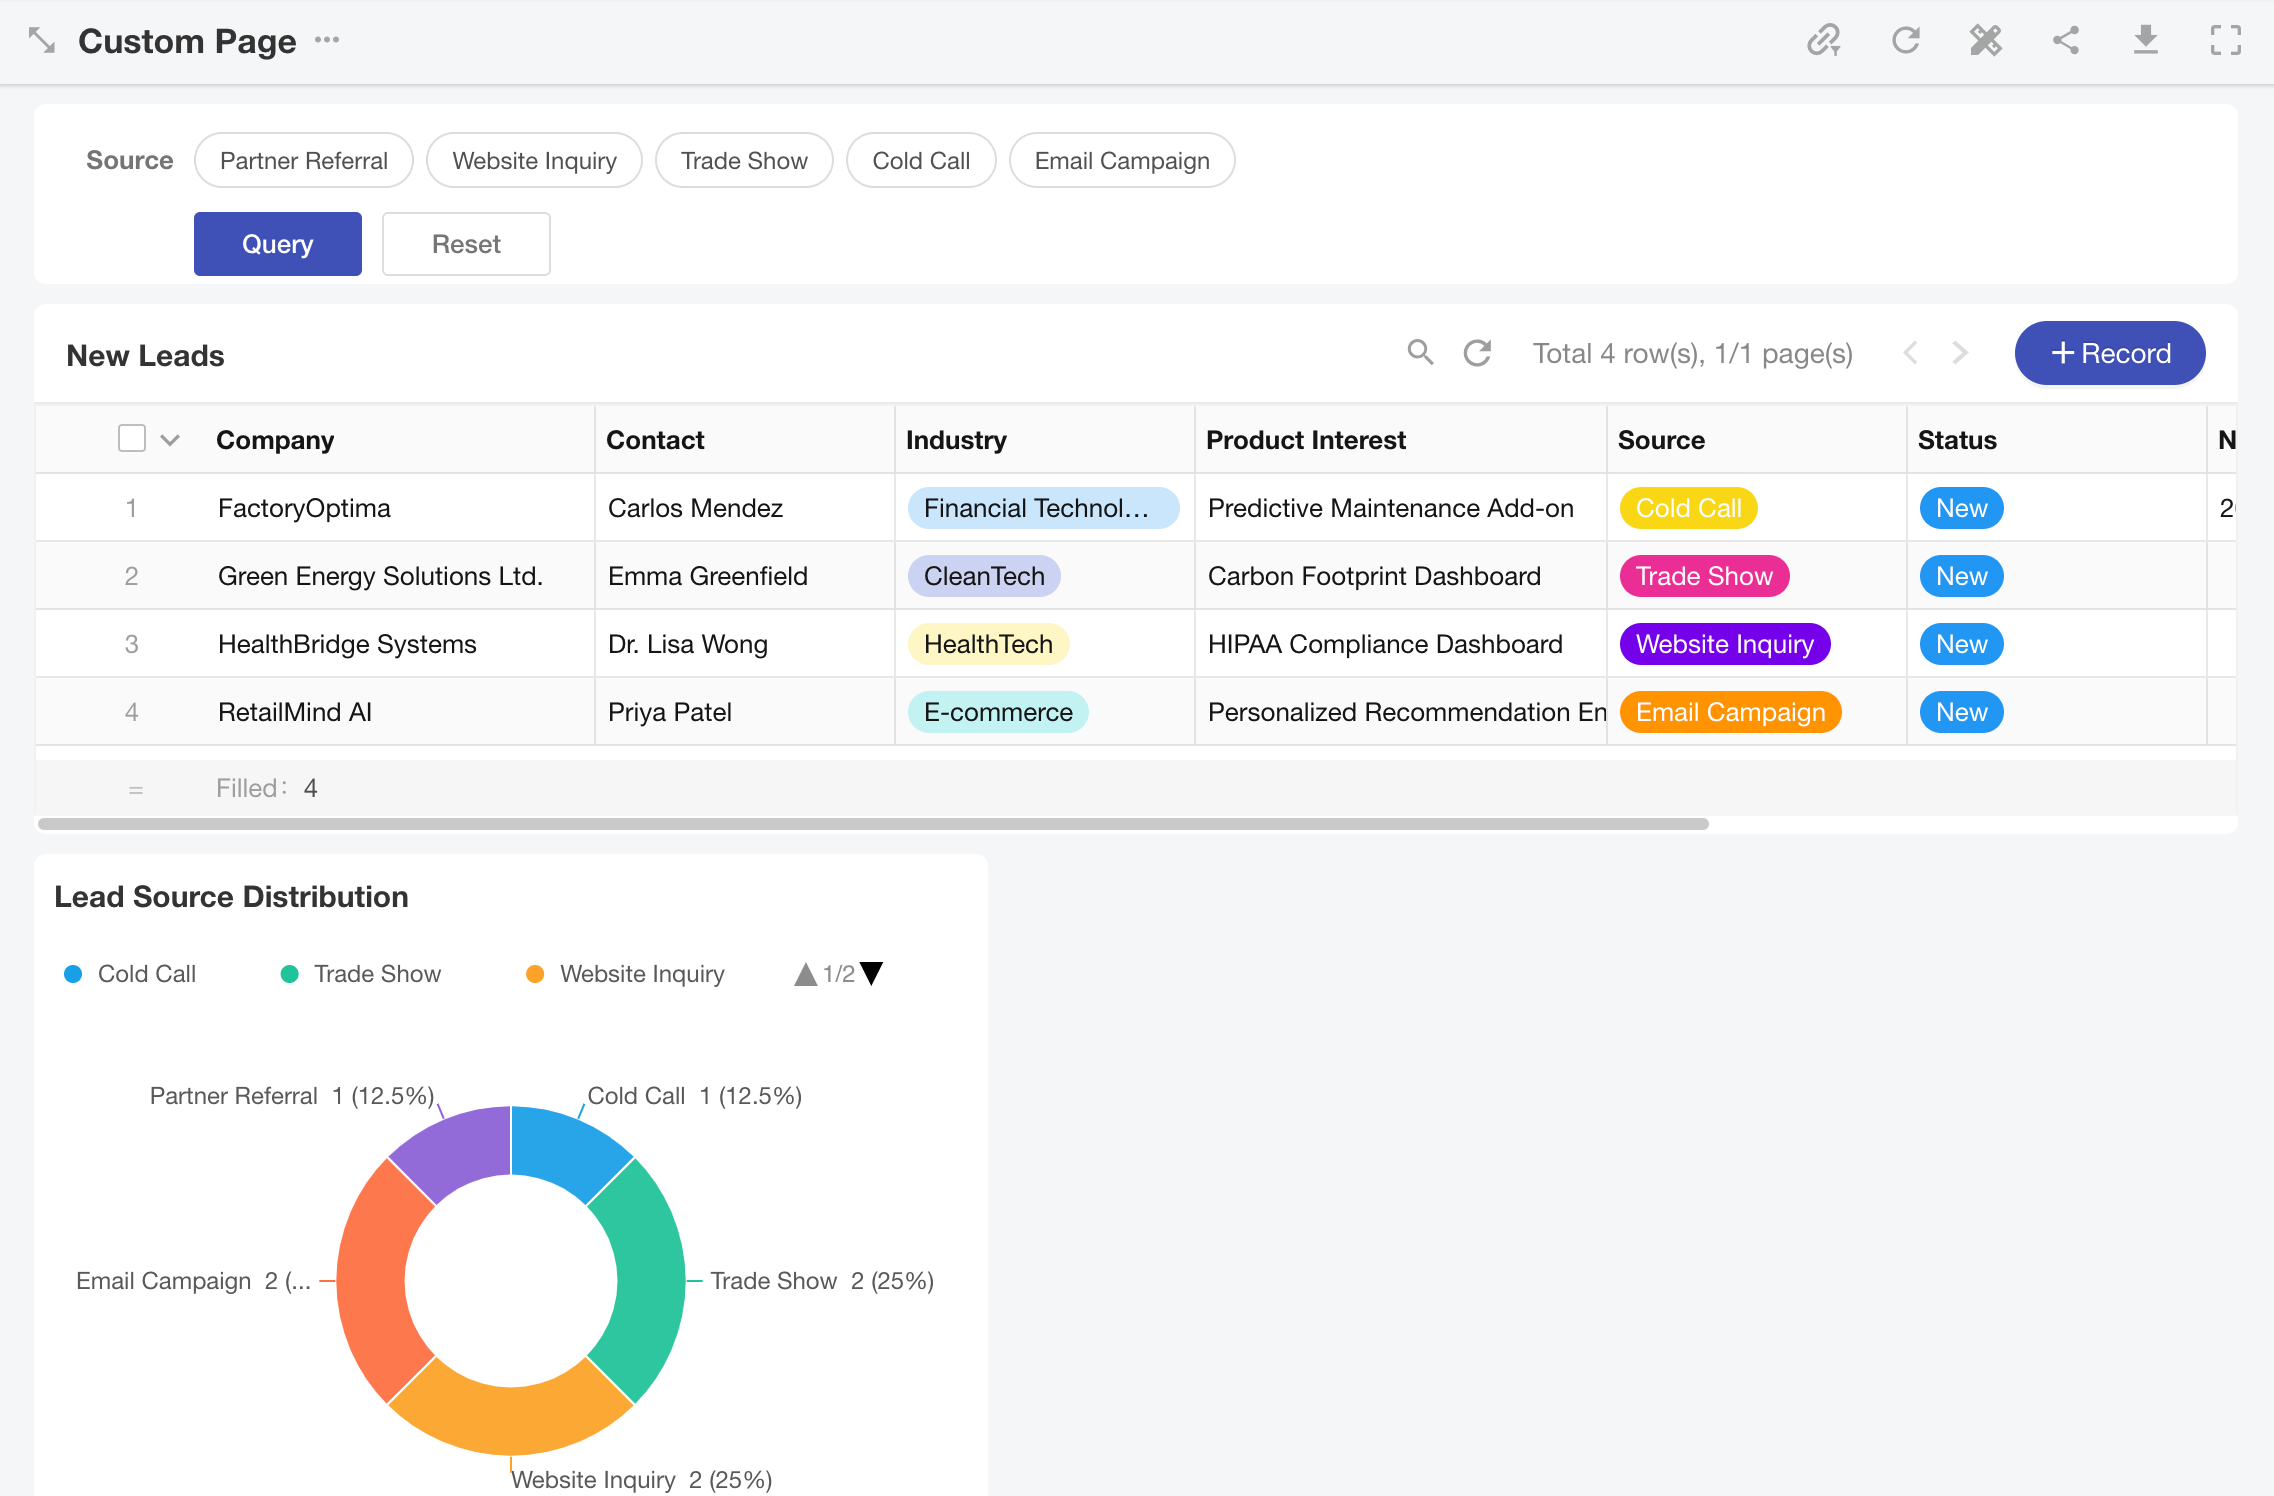
Example: Add a filter based on the "Source" field to view the relevant sales leads statistical data.
- Add chart or view that support filtering.
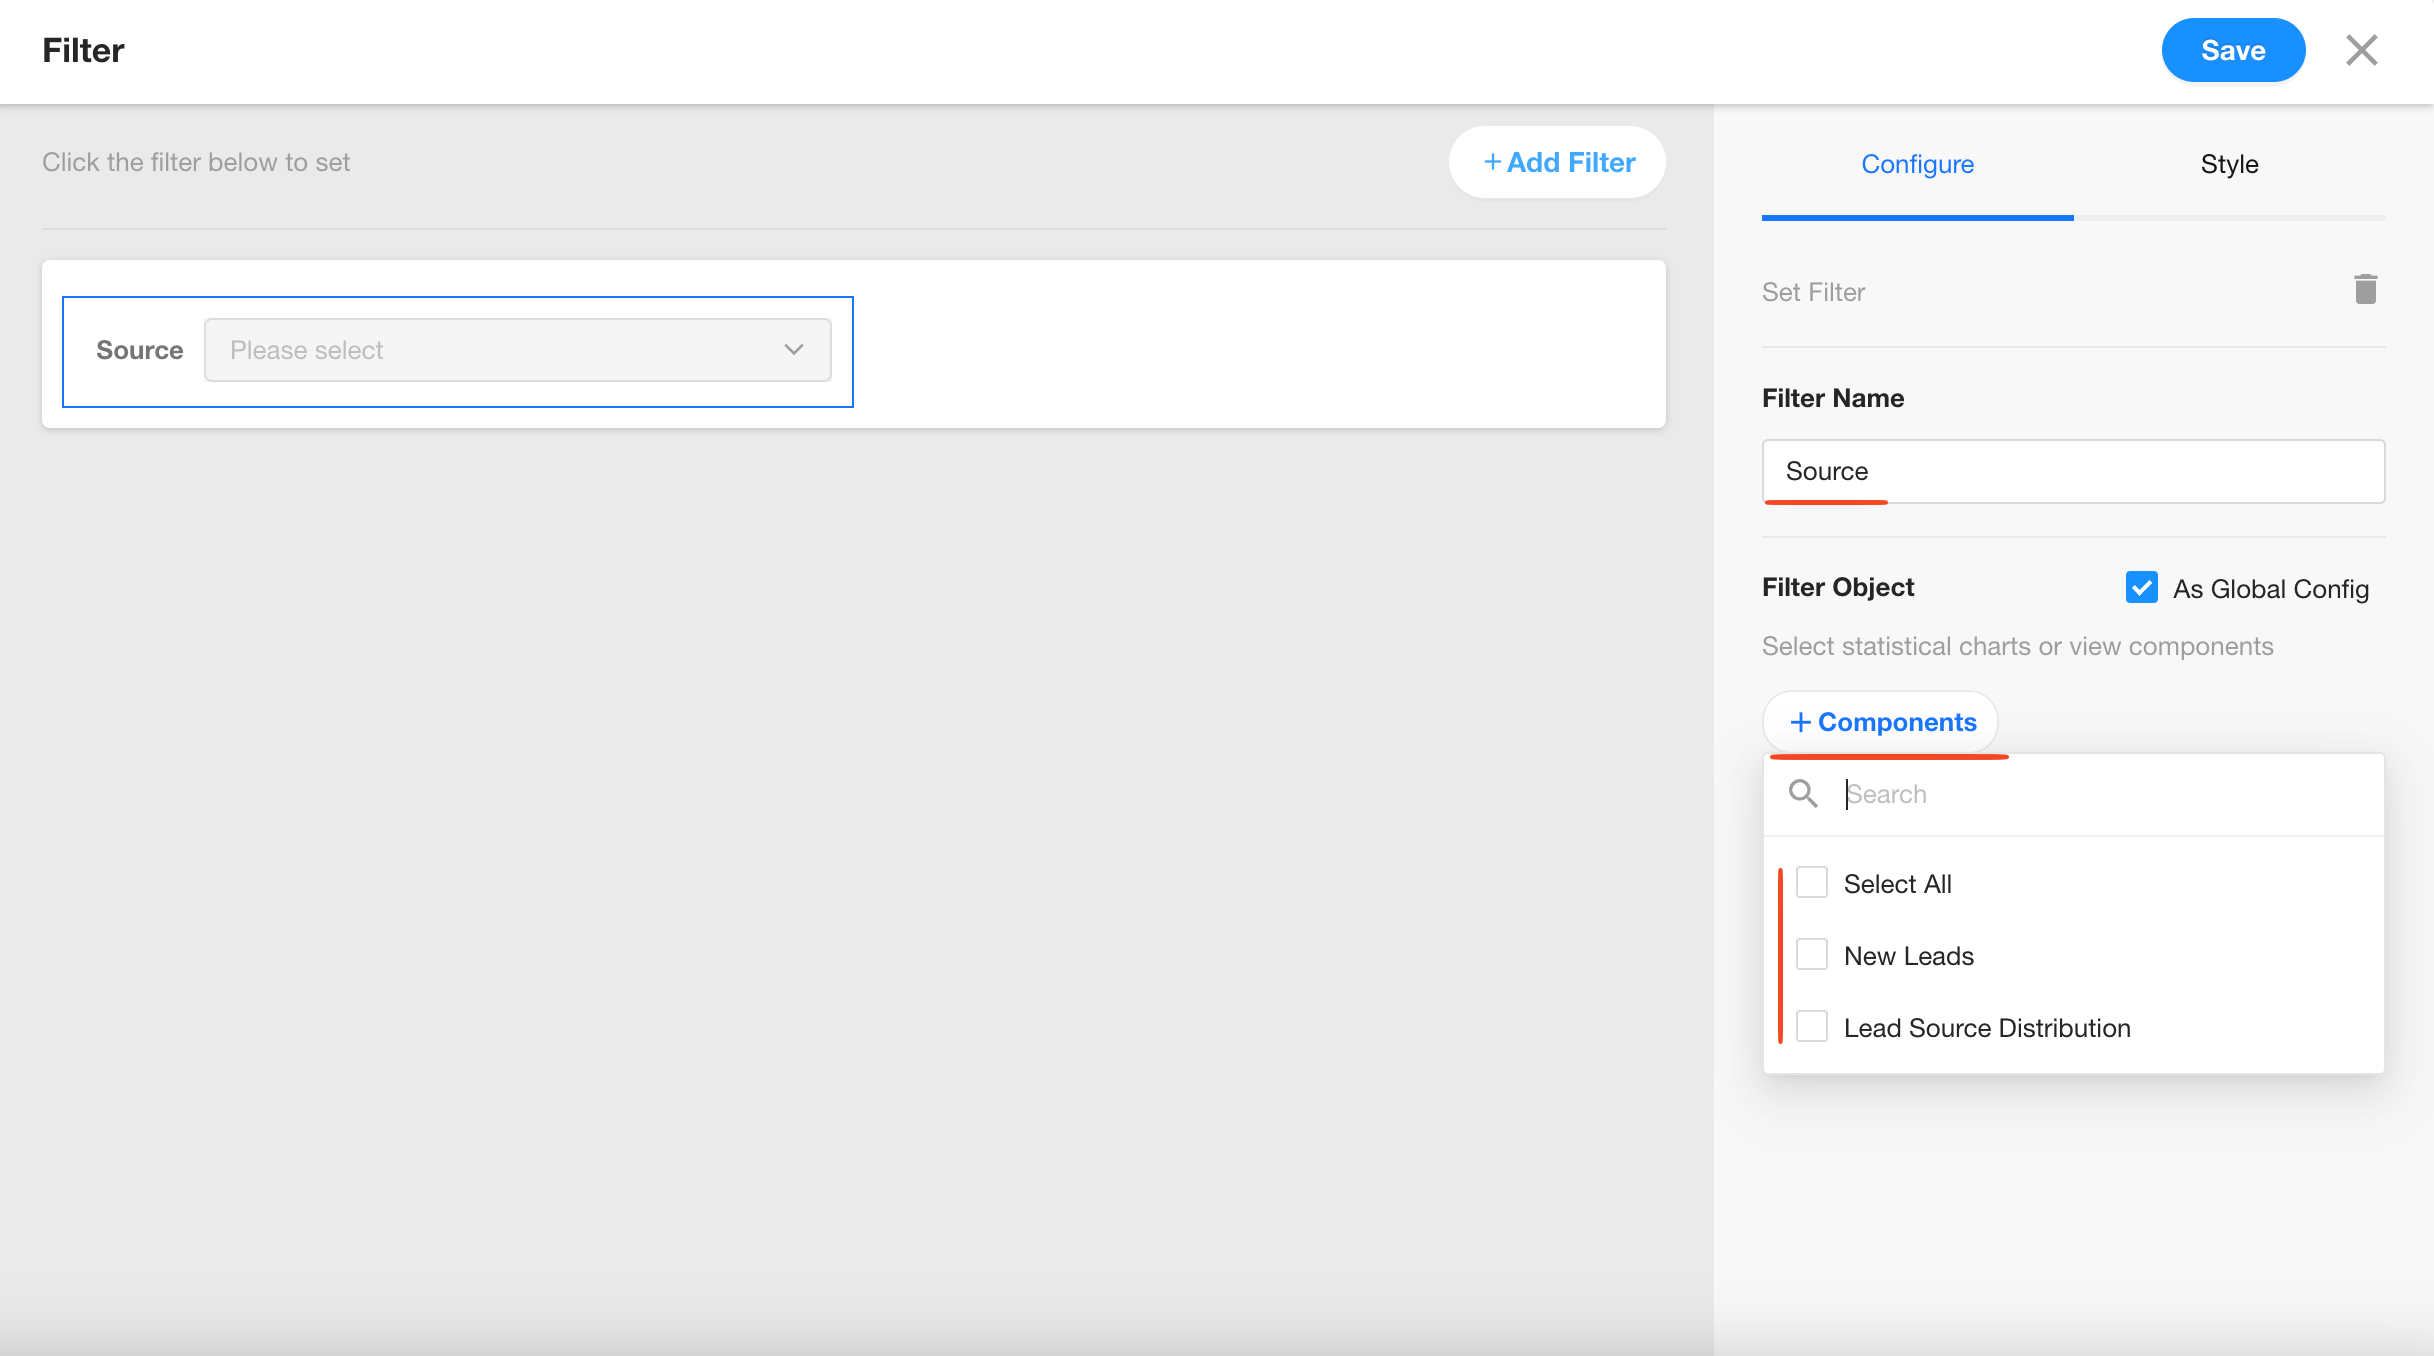
- Select the filter field from the worksheet linked to the selected chart or view.
The first worksheet determines the field type. All subsequent worksheets must use fields of the same type.
⚠️ Important: If the filter field is a single-select or multi-select field, all related worksheets must use the same option set. Otherwise, the filter will not be usable.
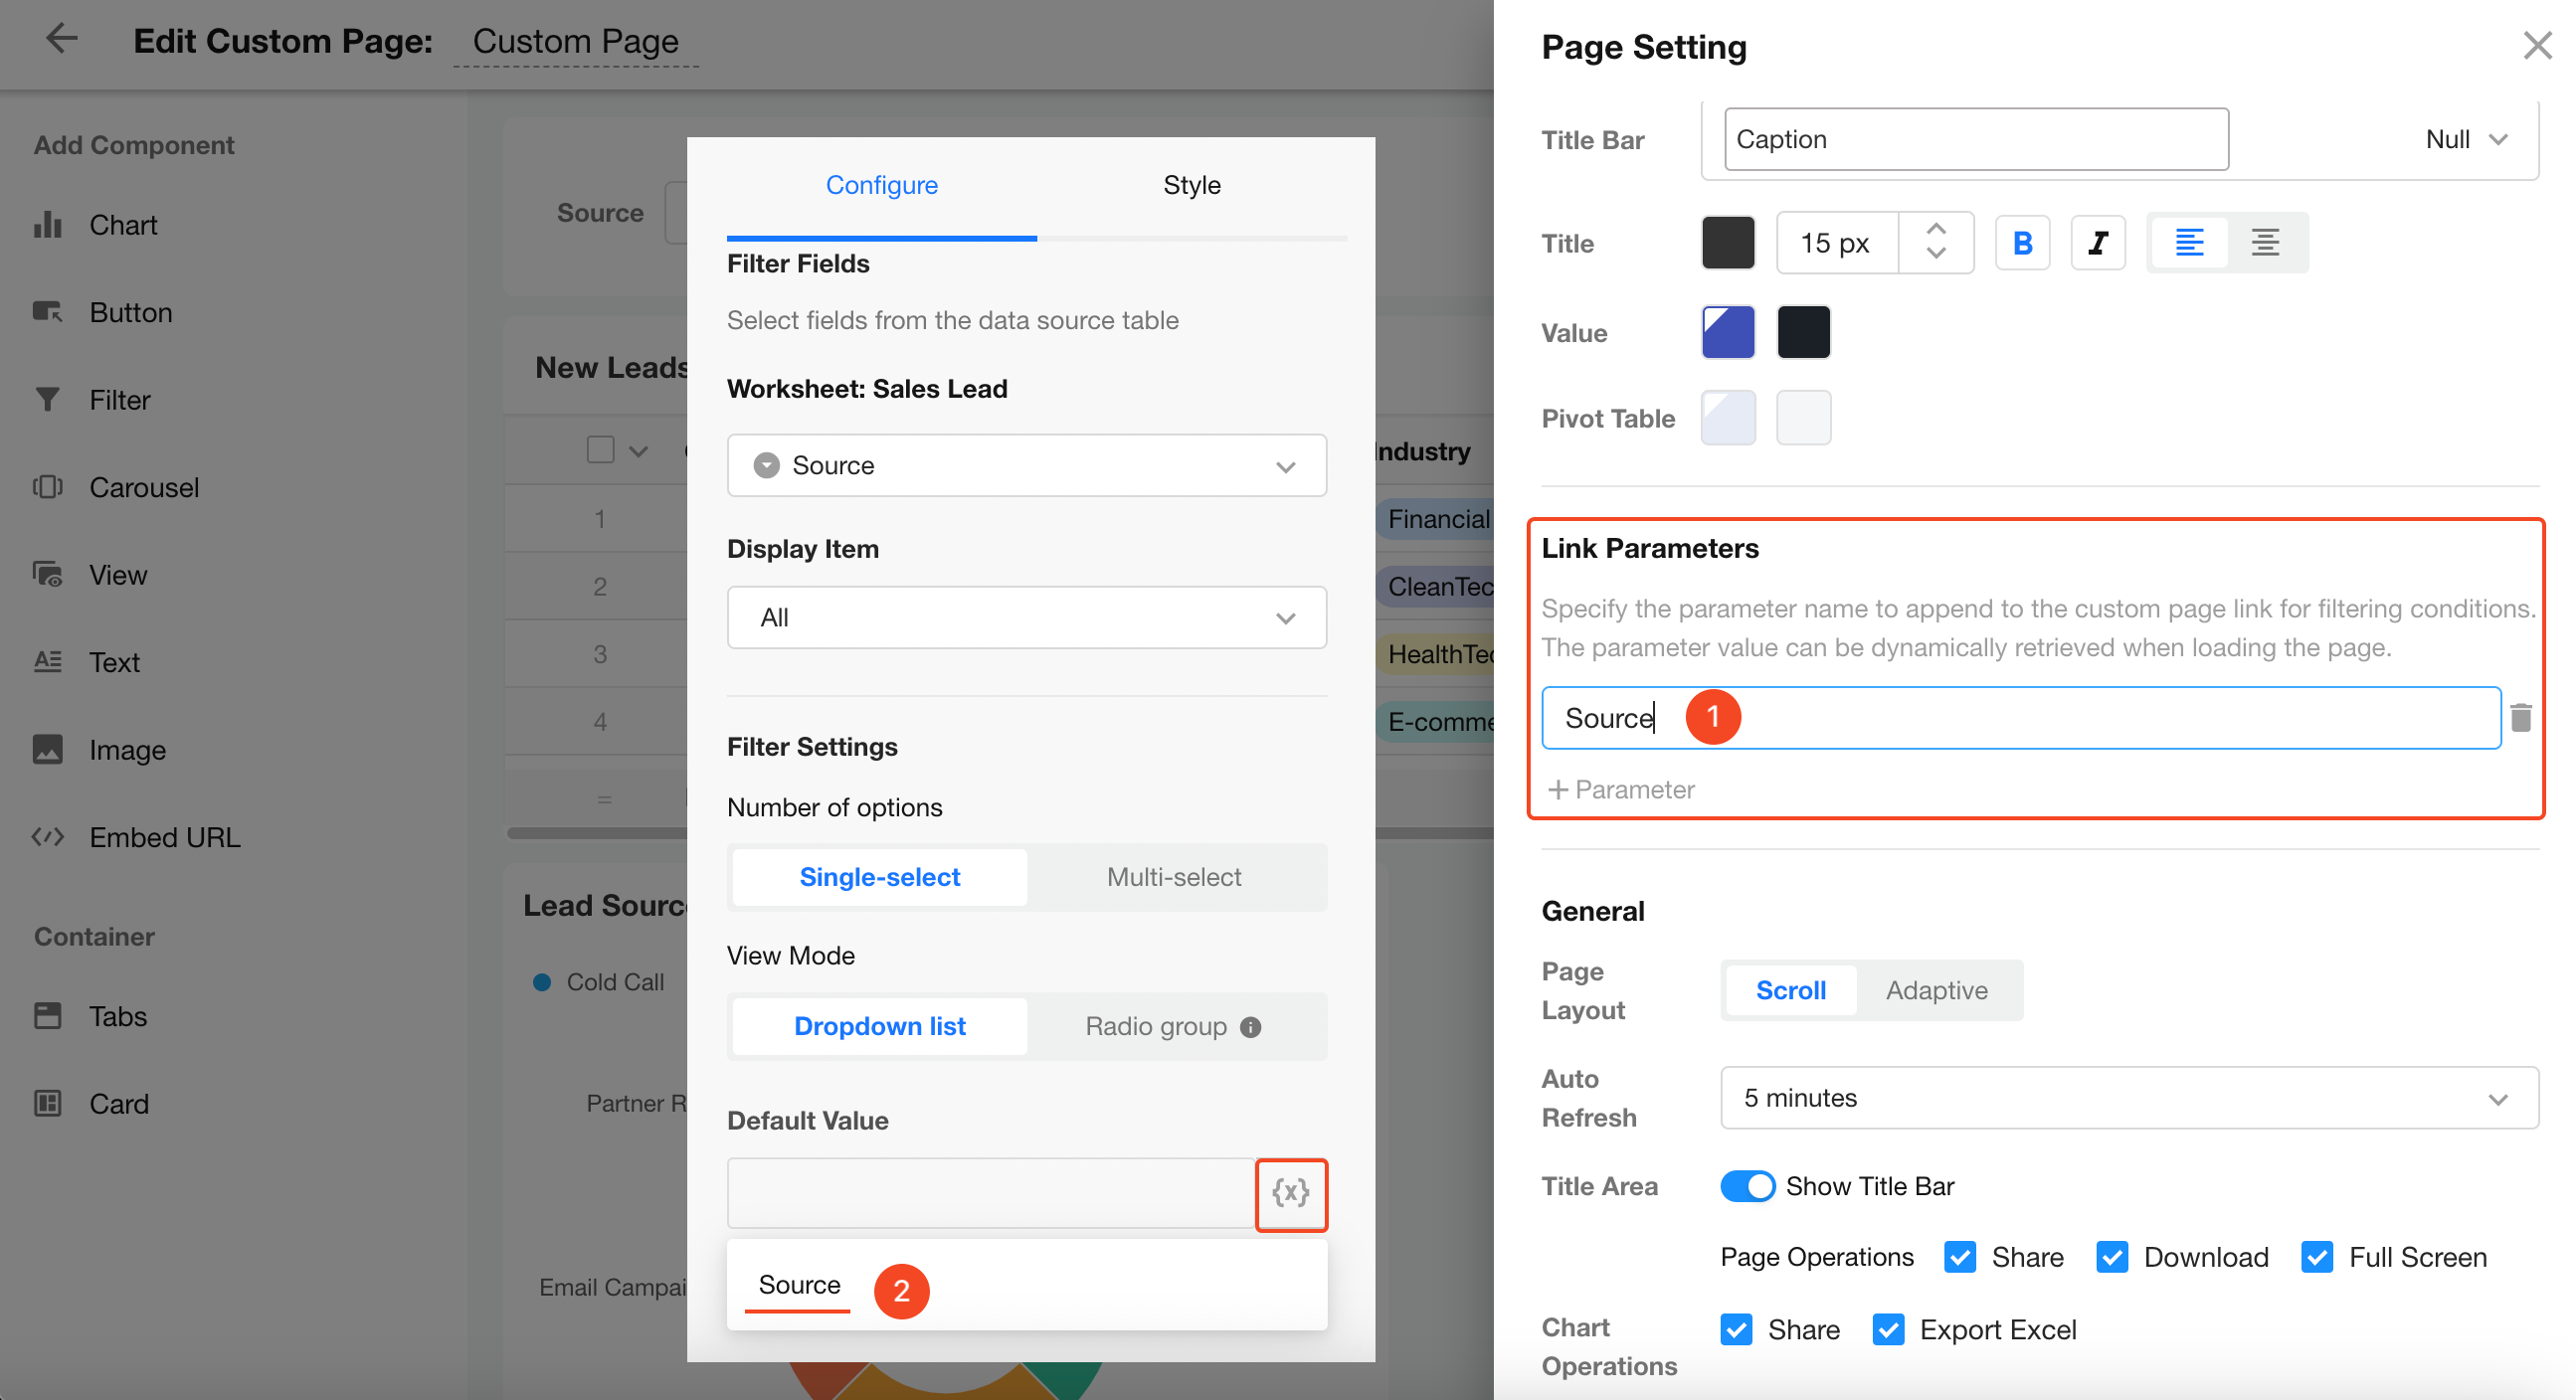
4. Default Value
You can assign a default filter value using custom page parameters. When the page loads, the filter can automatically retrieve and apply the parameter value.
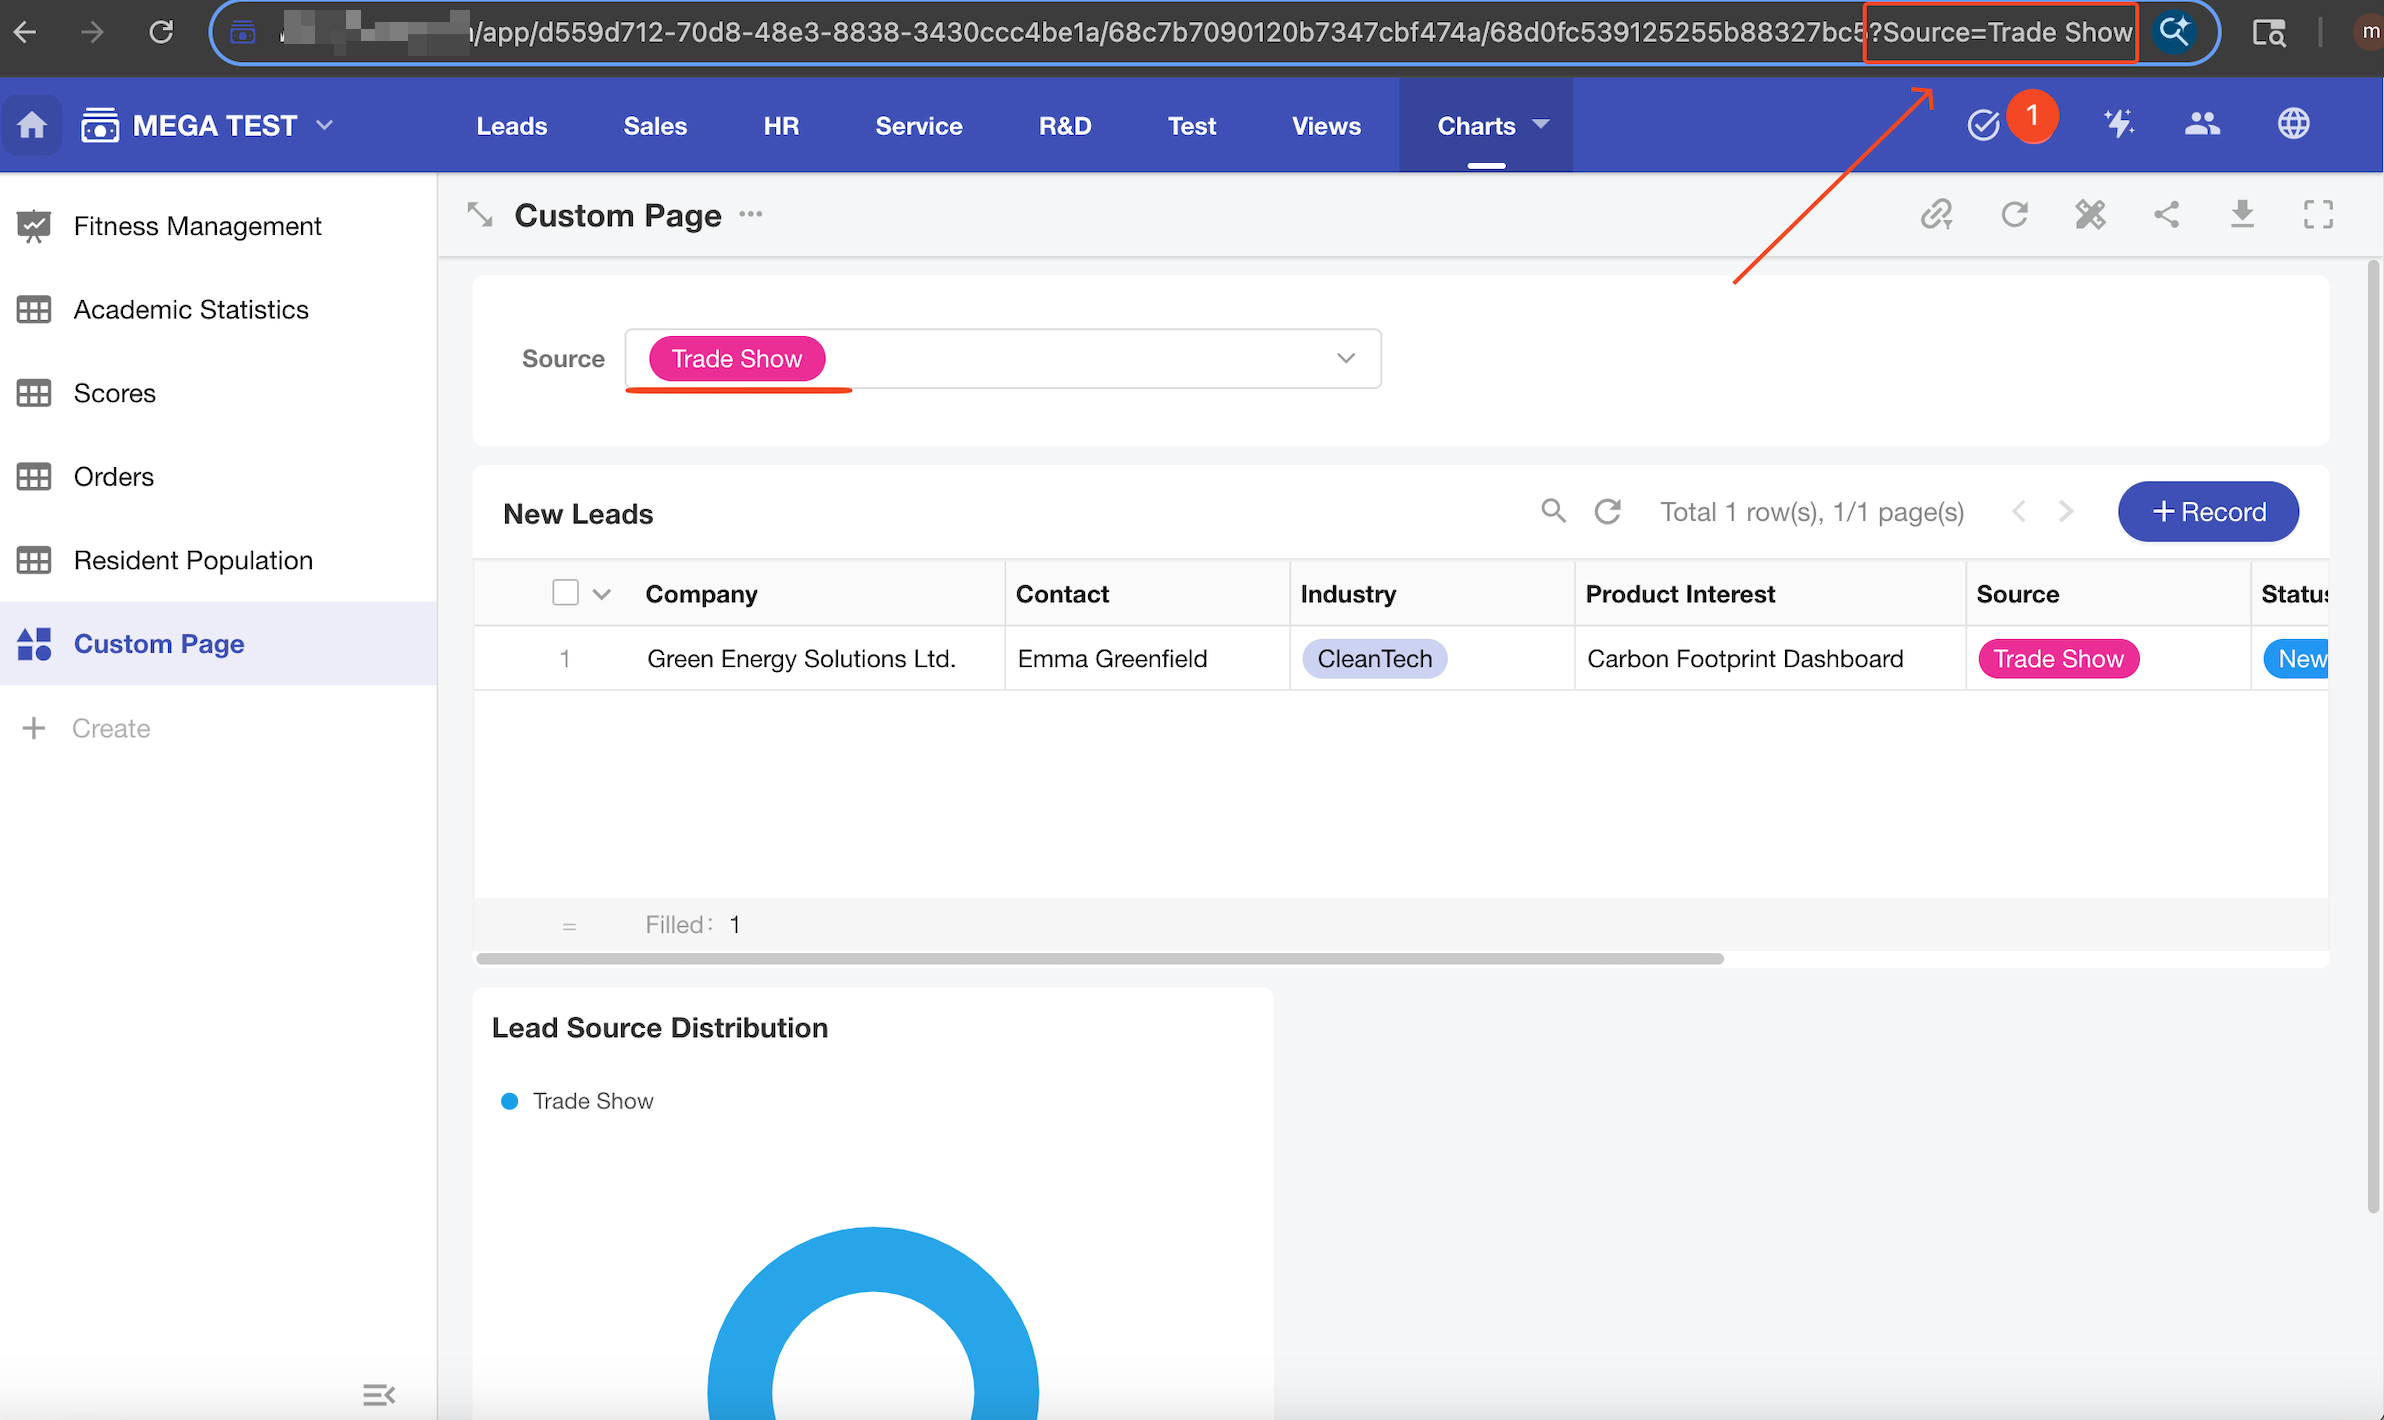
Example Result:
5. Additional Features
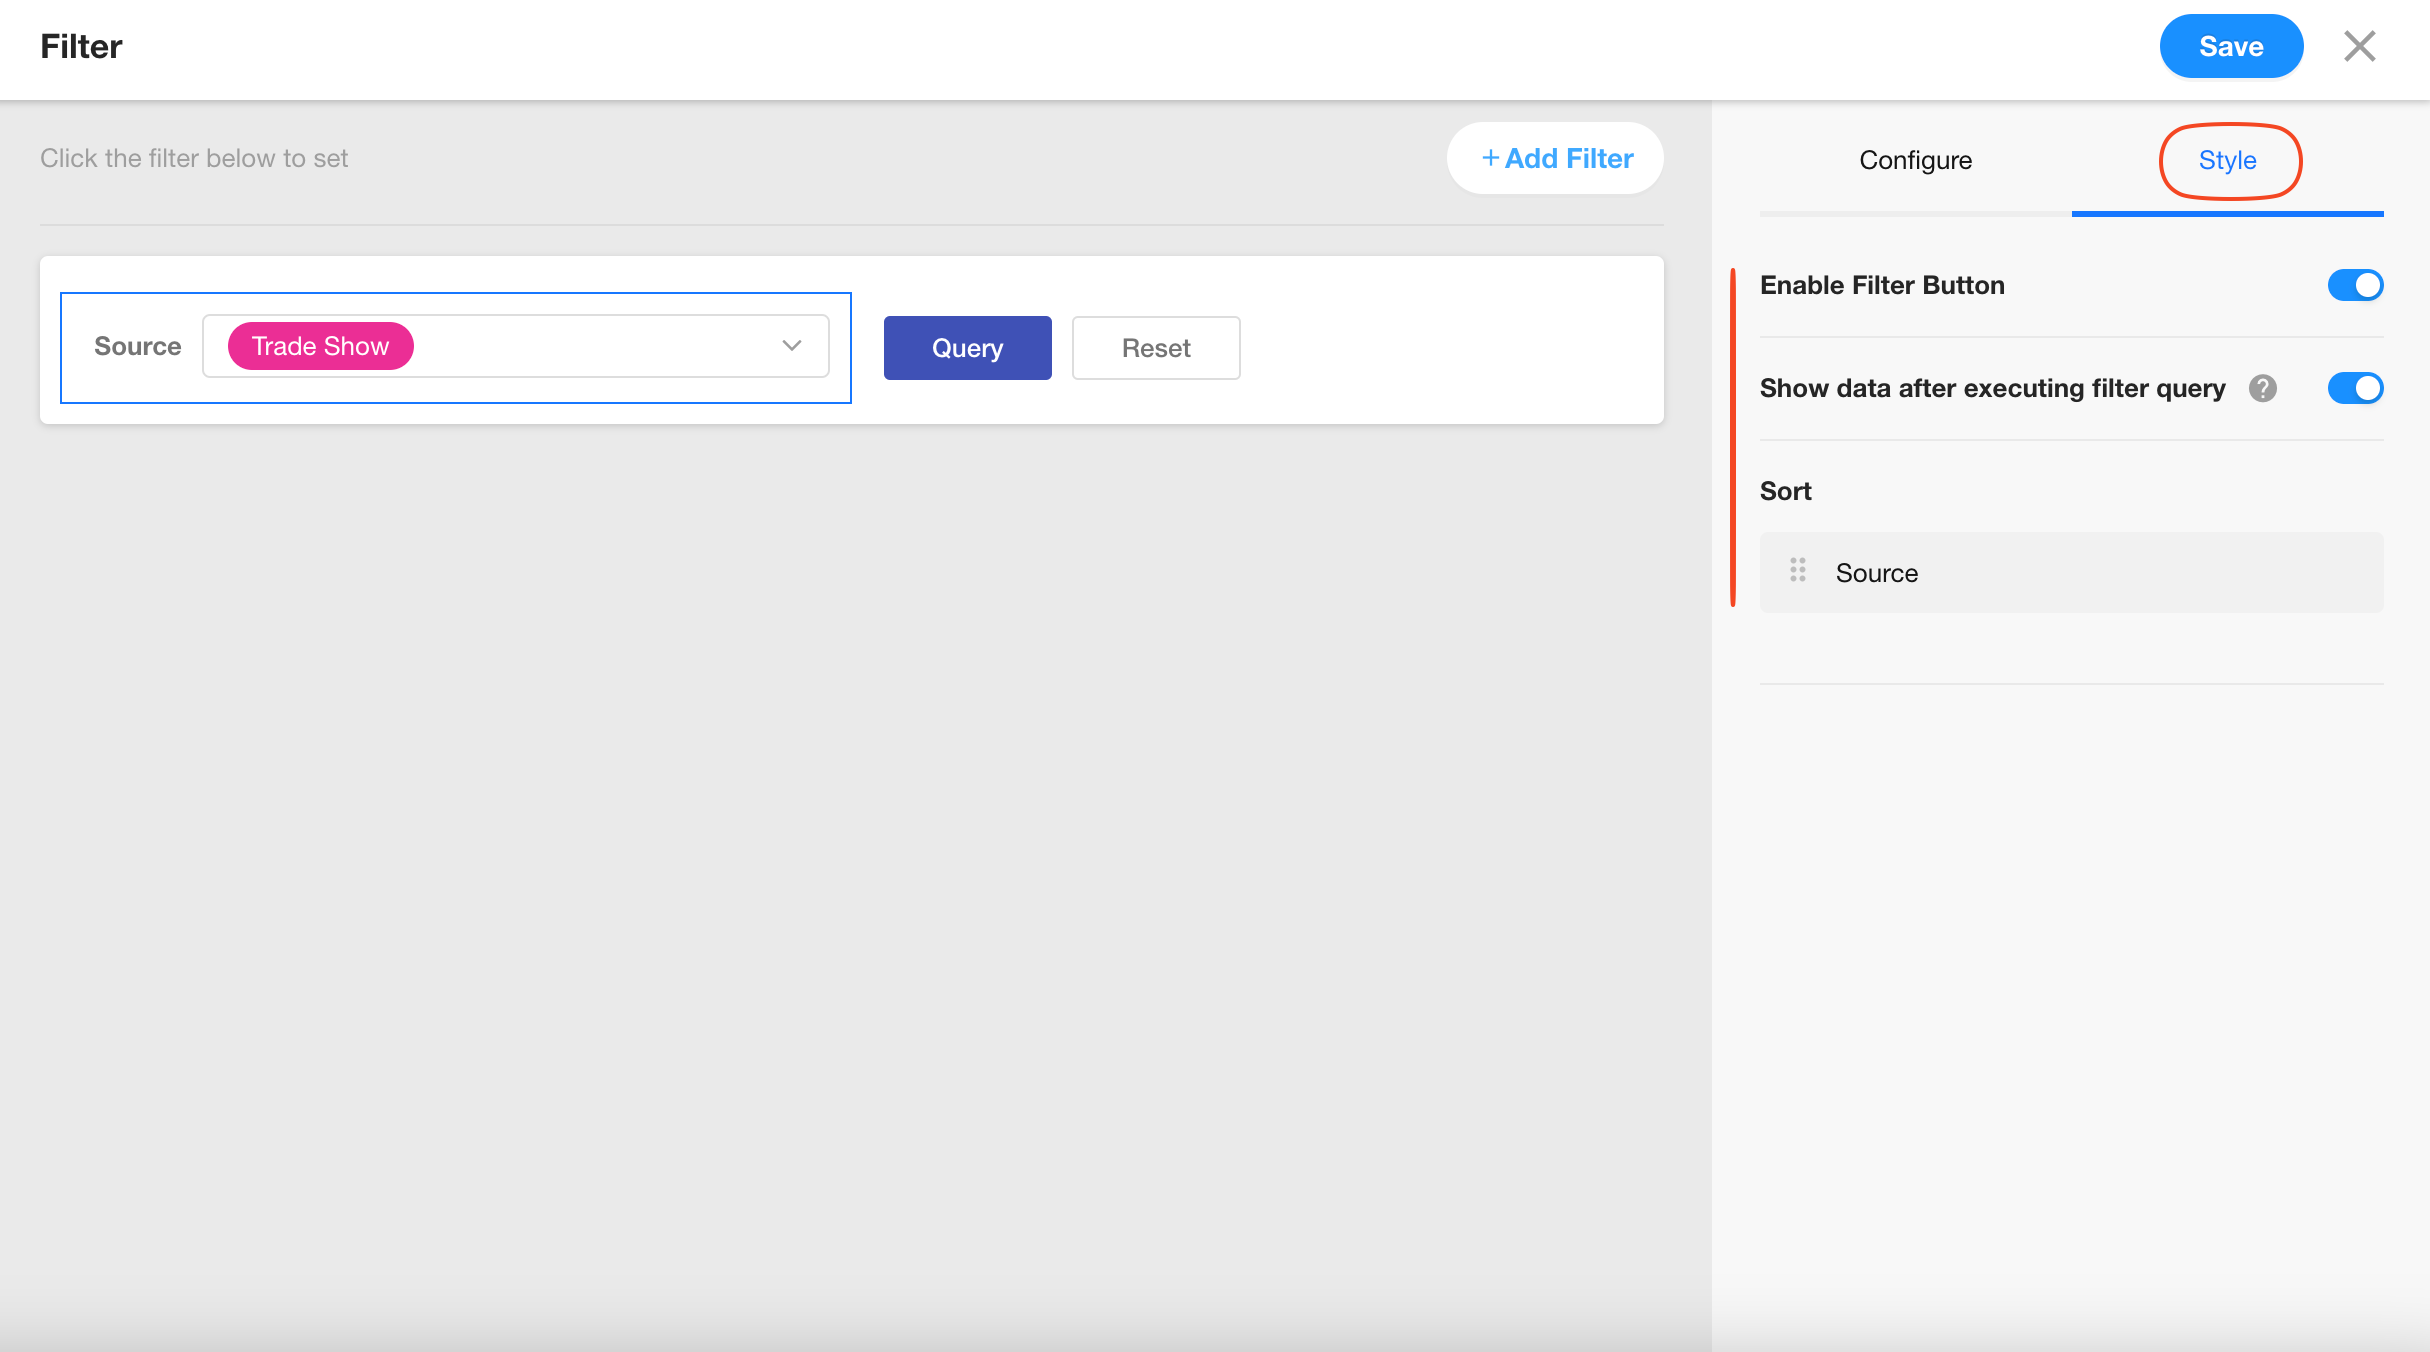
Enable Filter Button
When enabled, users must click the Query button after selecting filter conditions to trigger the query.
When disabled, the "Query" and "Reset" buttons will be hidden, and each filter selection will automatically refresh the charts or views.
Show Data Only After Filter Execution
When enabled, data in charts and views will be hidden by default and show a message like “Run the query to display results.” Data will only appear after filters are applied.
Sort Filter Fields
If there are multiple filter fields in the component, you can adjust their display order using drag-and-drop.
Set as Global Filter
By default, different filter fields may apply to different charts or views. Enabling “As global config” makes all filter fields use the same target components. Disabling it allows each field to target different charts or views independently.
6. Save the Filter
Once all configurations are complete, click Save. The filter will now appear on the custom page and can be used to interactively filter charts and views.
Was this document helpful?