Map View
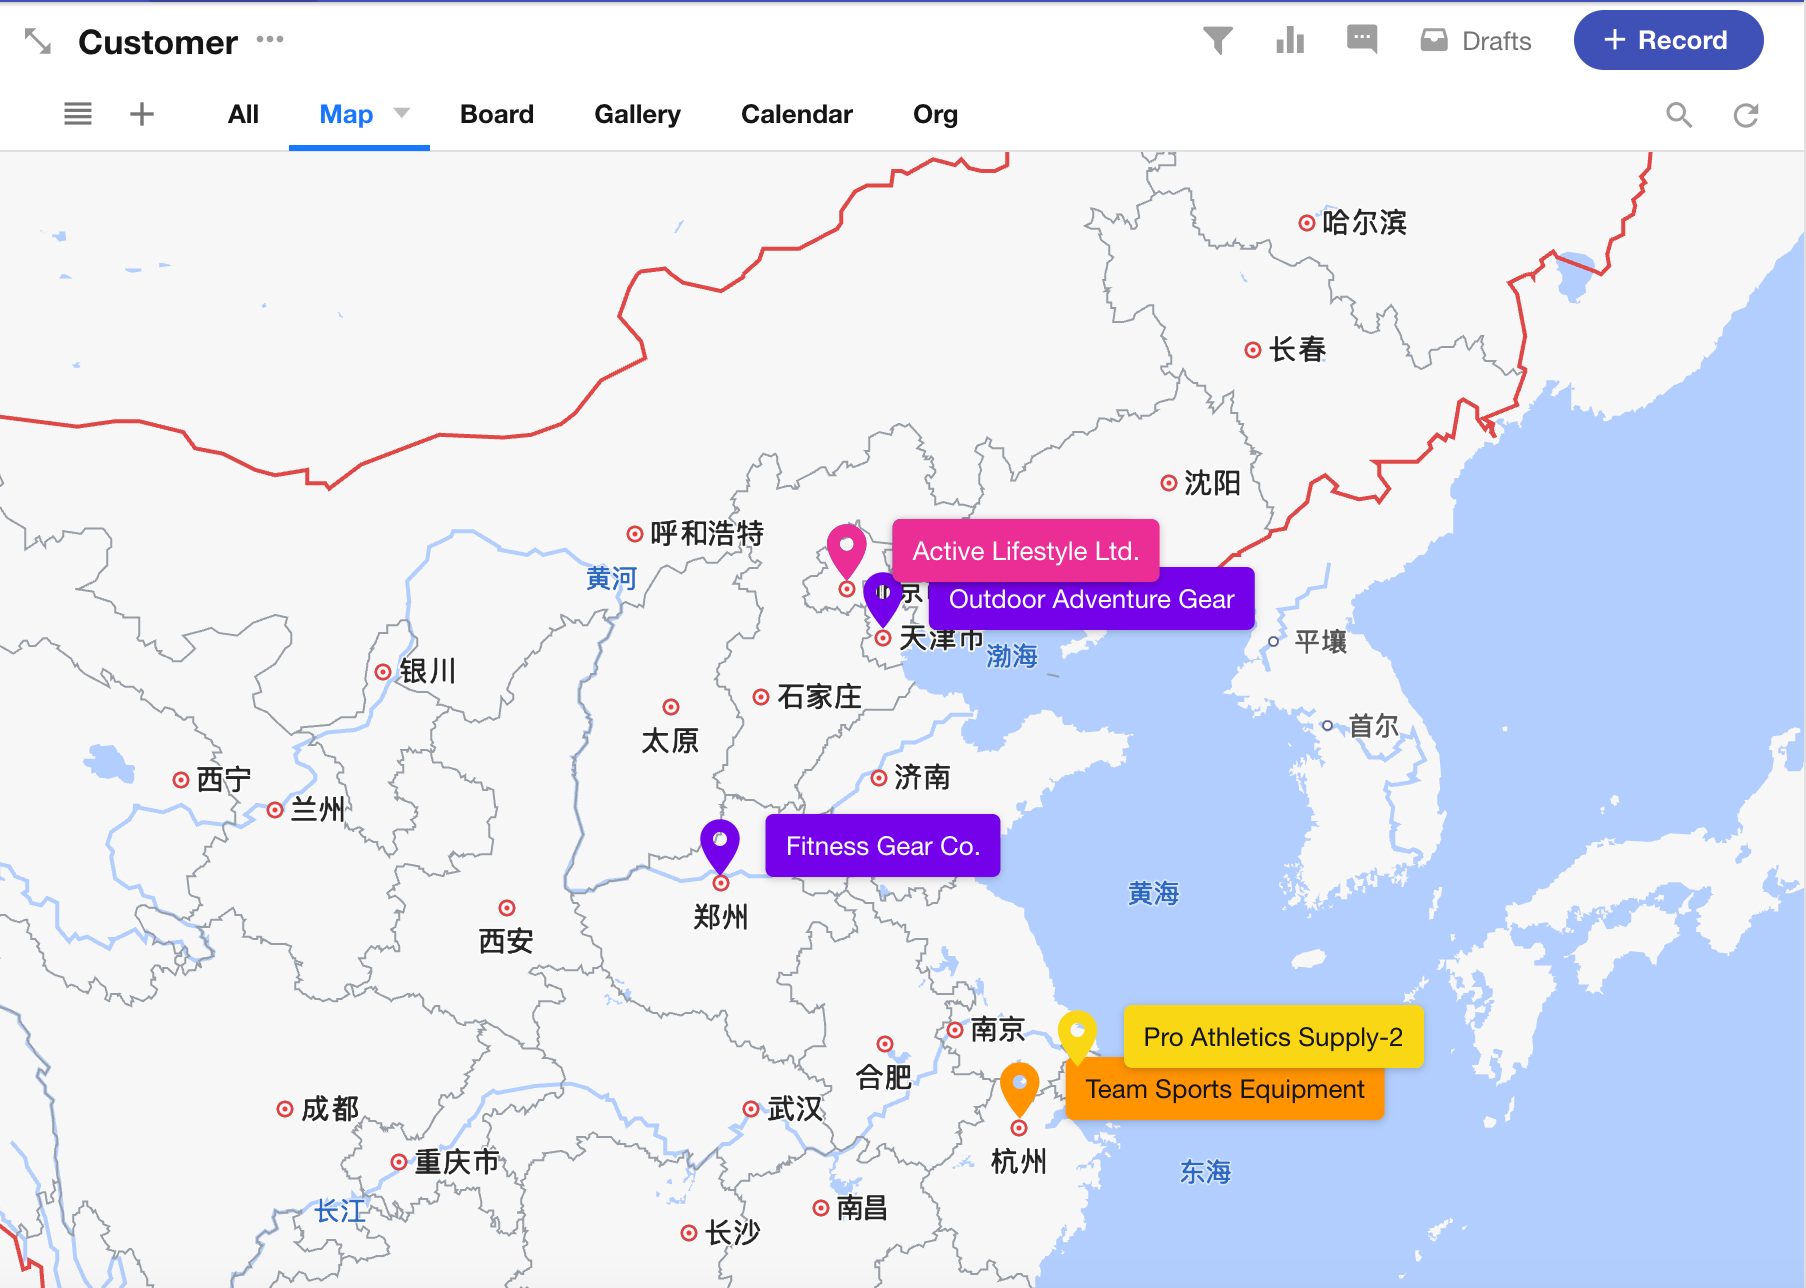
The Map View allows you to visually display location data from a positioning field in your worksheet. It provides a clear overview of coordinates on a map, enabling users to quickly retrieve location information and perform spatial analysis. In addition to displaying coordinates, the Map View also supports tag coloring, additional field display, and cover image customization.
Creating a Map View
-
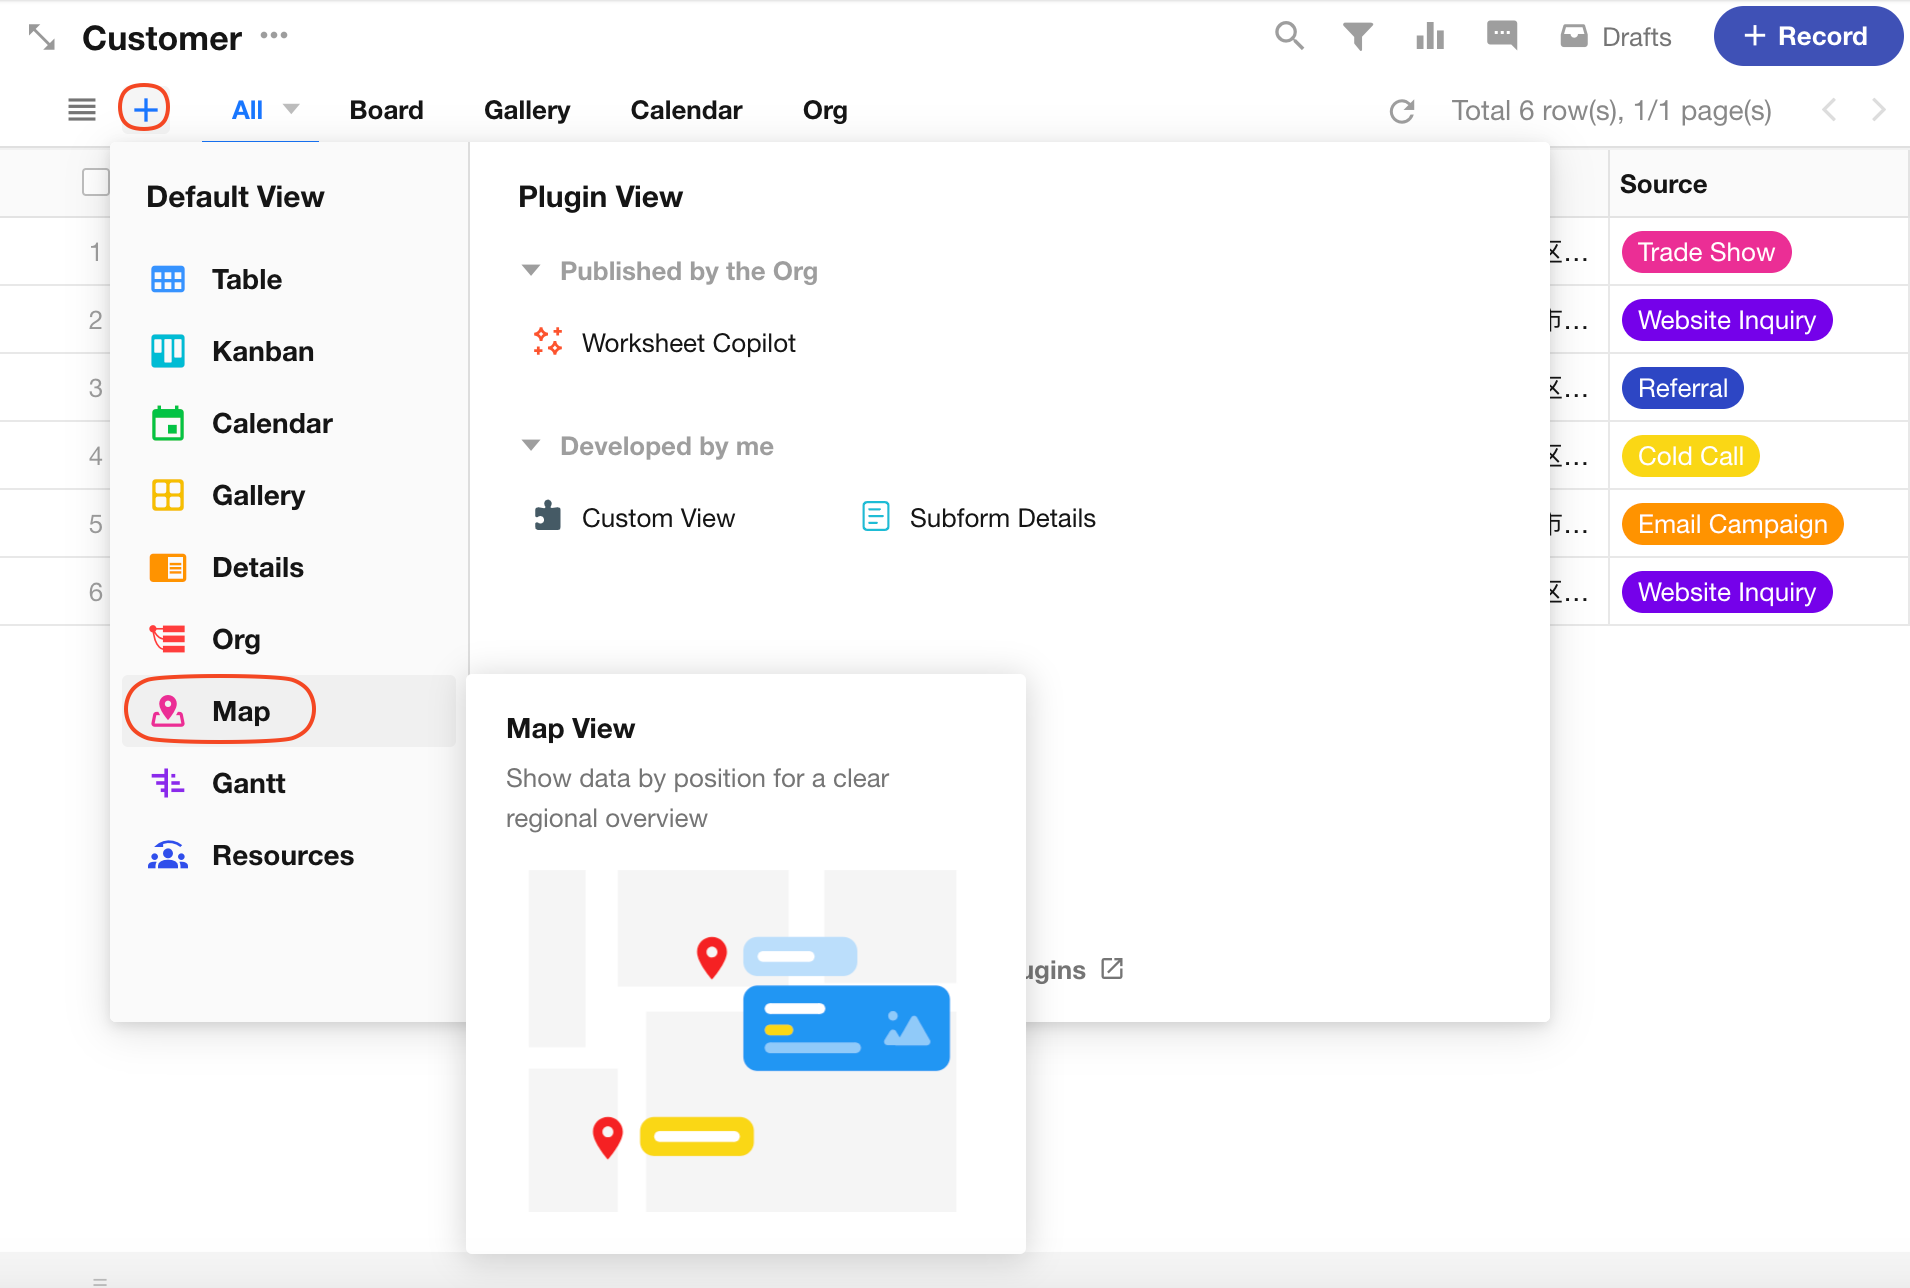
Click the “+” button and select Map View.
-
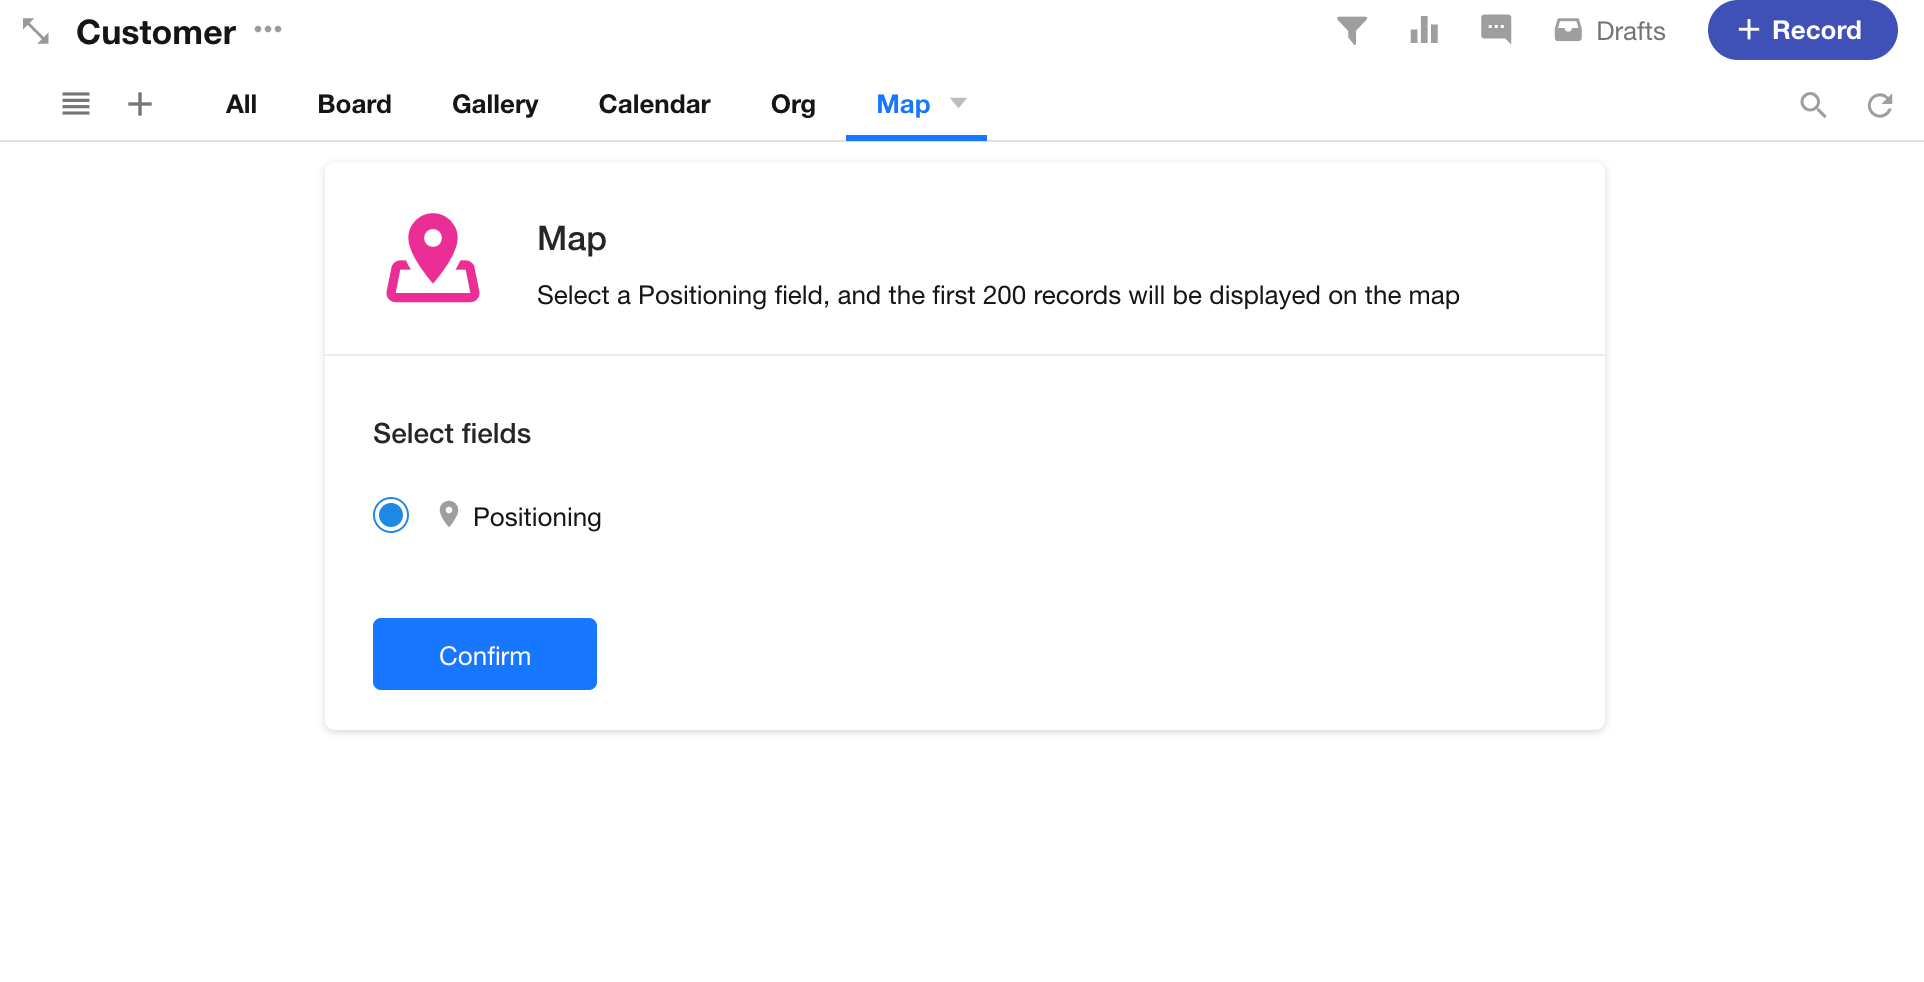
Choose a positioning field to display its data on the map. Up to 200 records can be shown.
View Configuration
This section focuses on the card settings in the Map View. Other view settings like filtering, sorting, color rules, and custom actions follow the same configuration as the Table View and are not covered here.
Card Settings
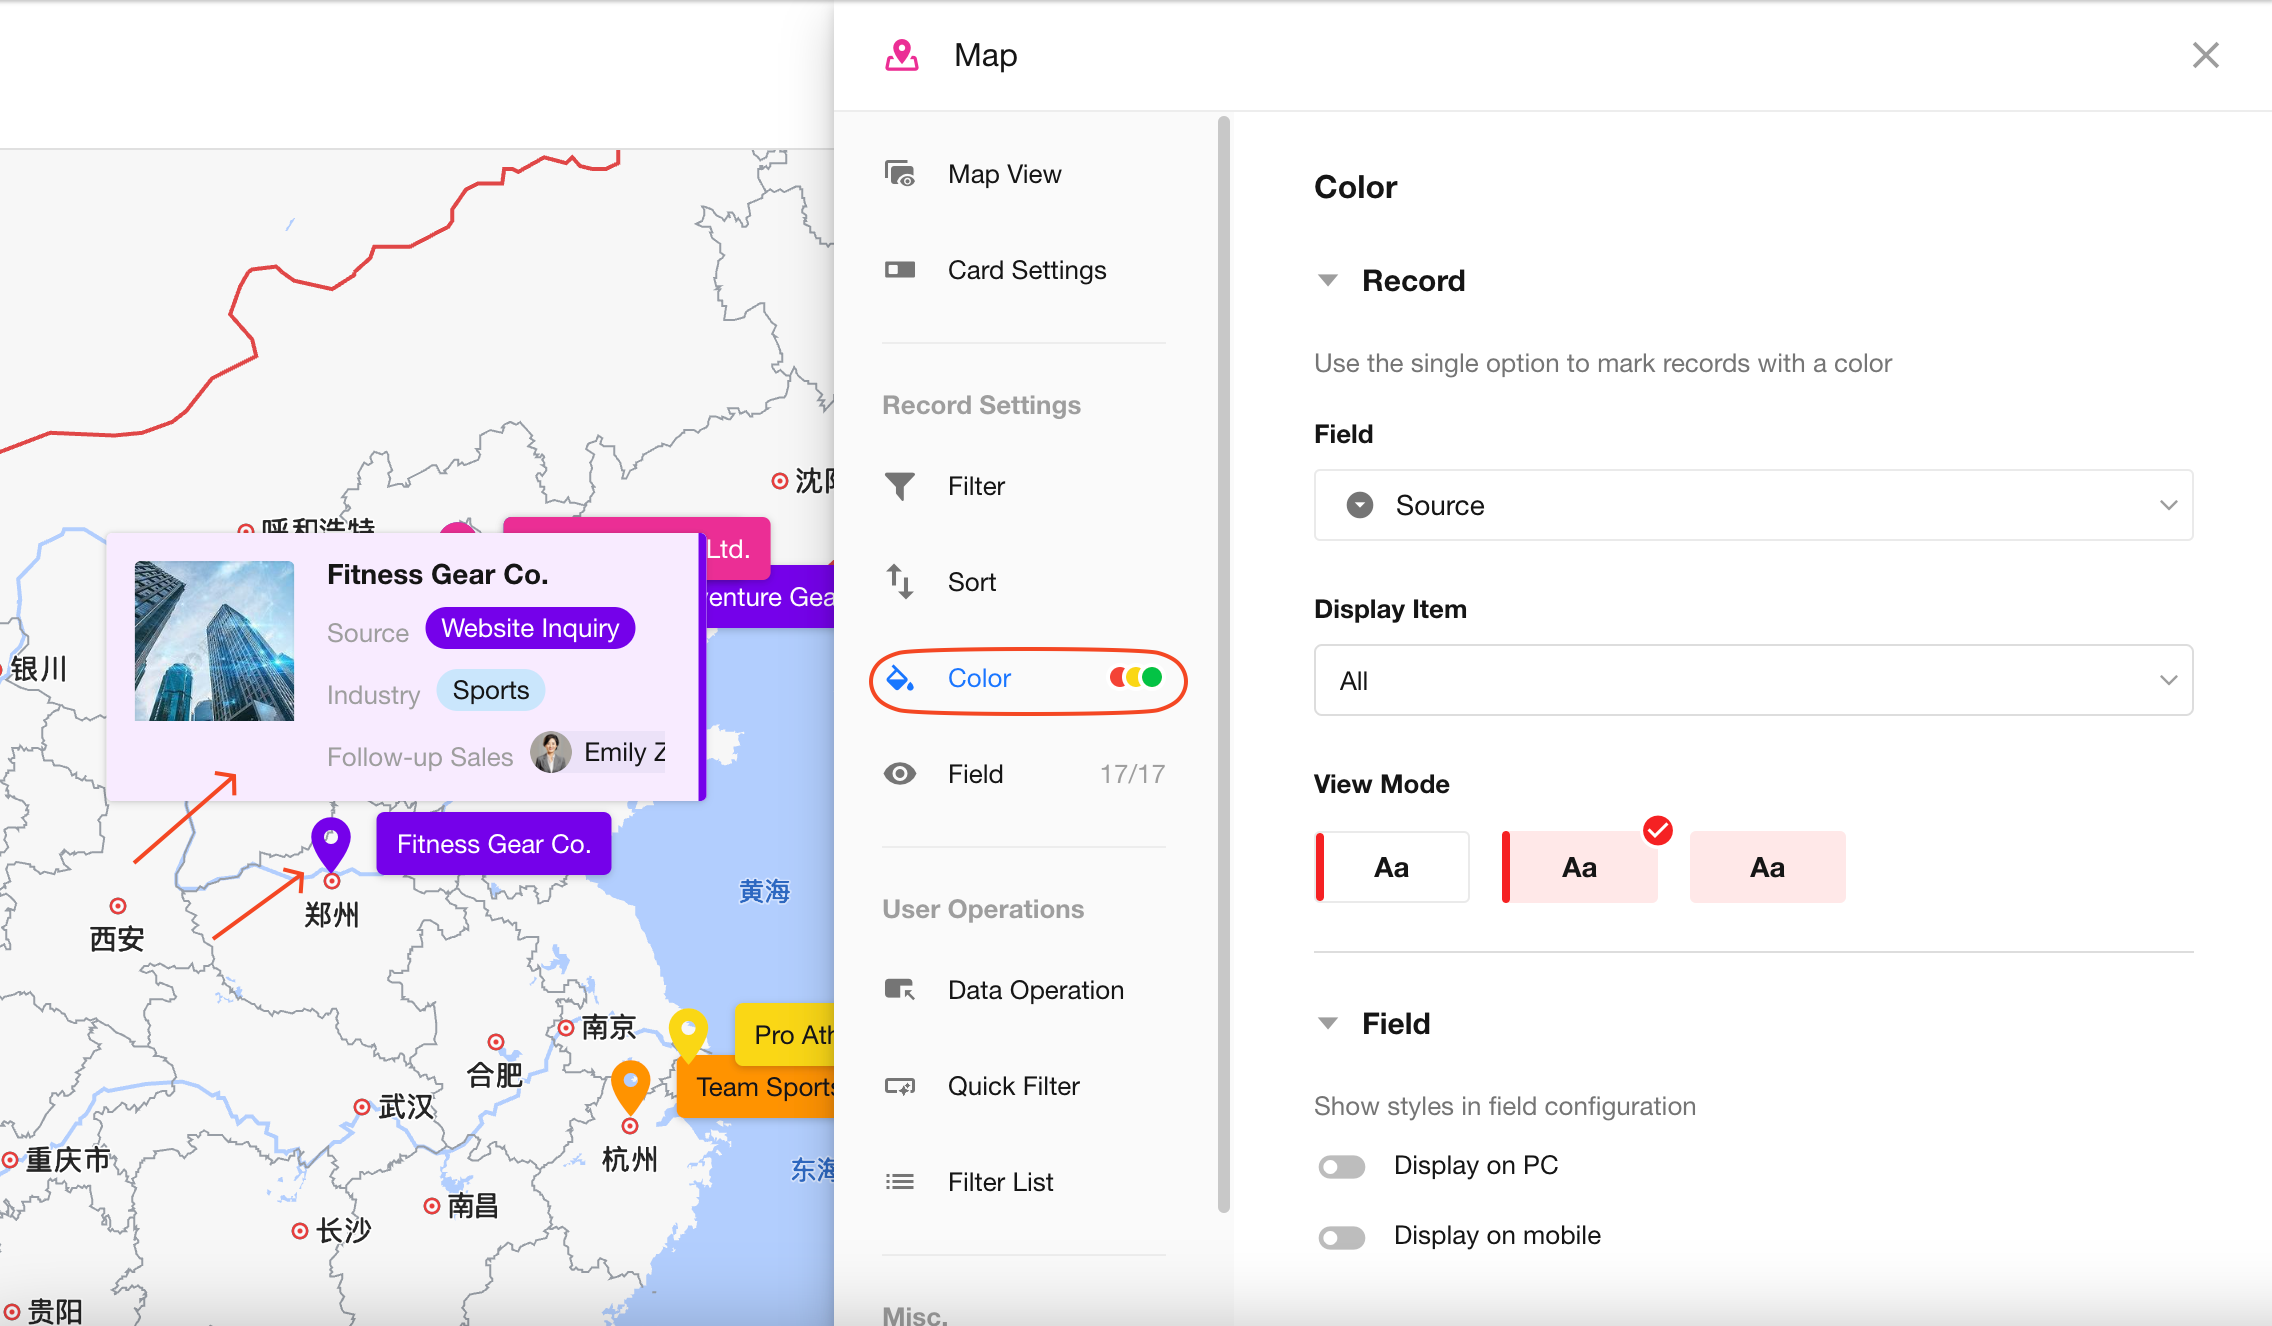
When hovering over a map marker, a record card is shown.
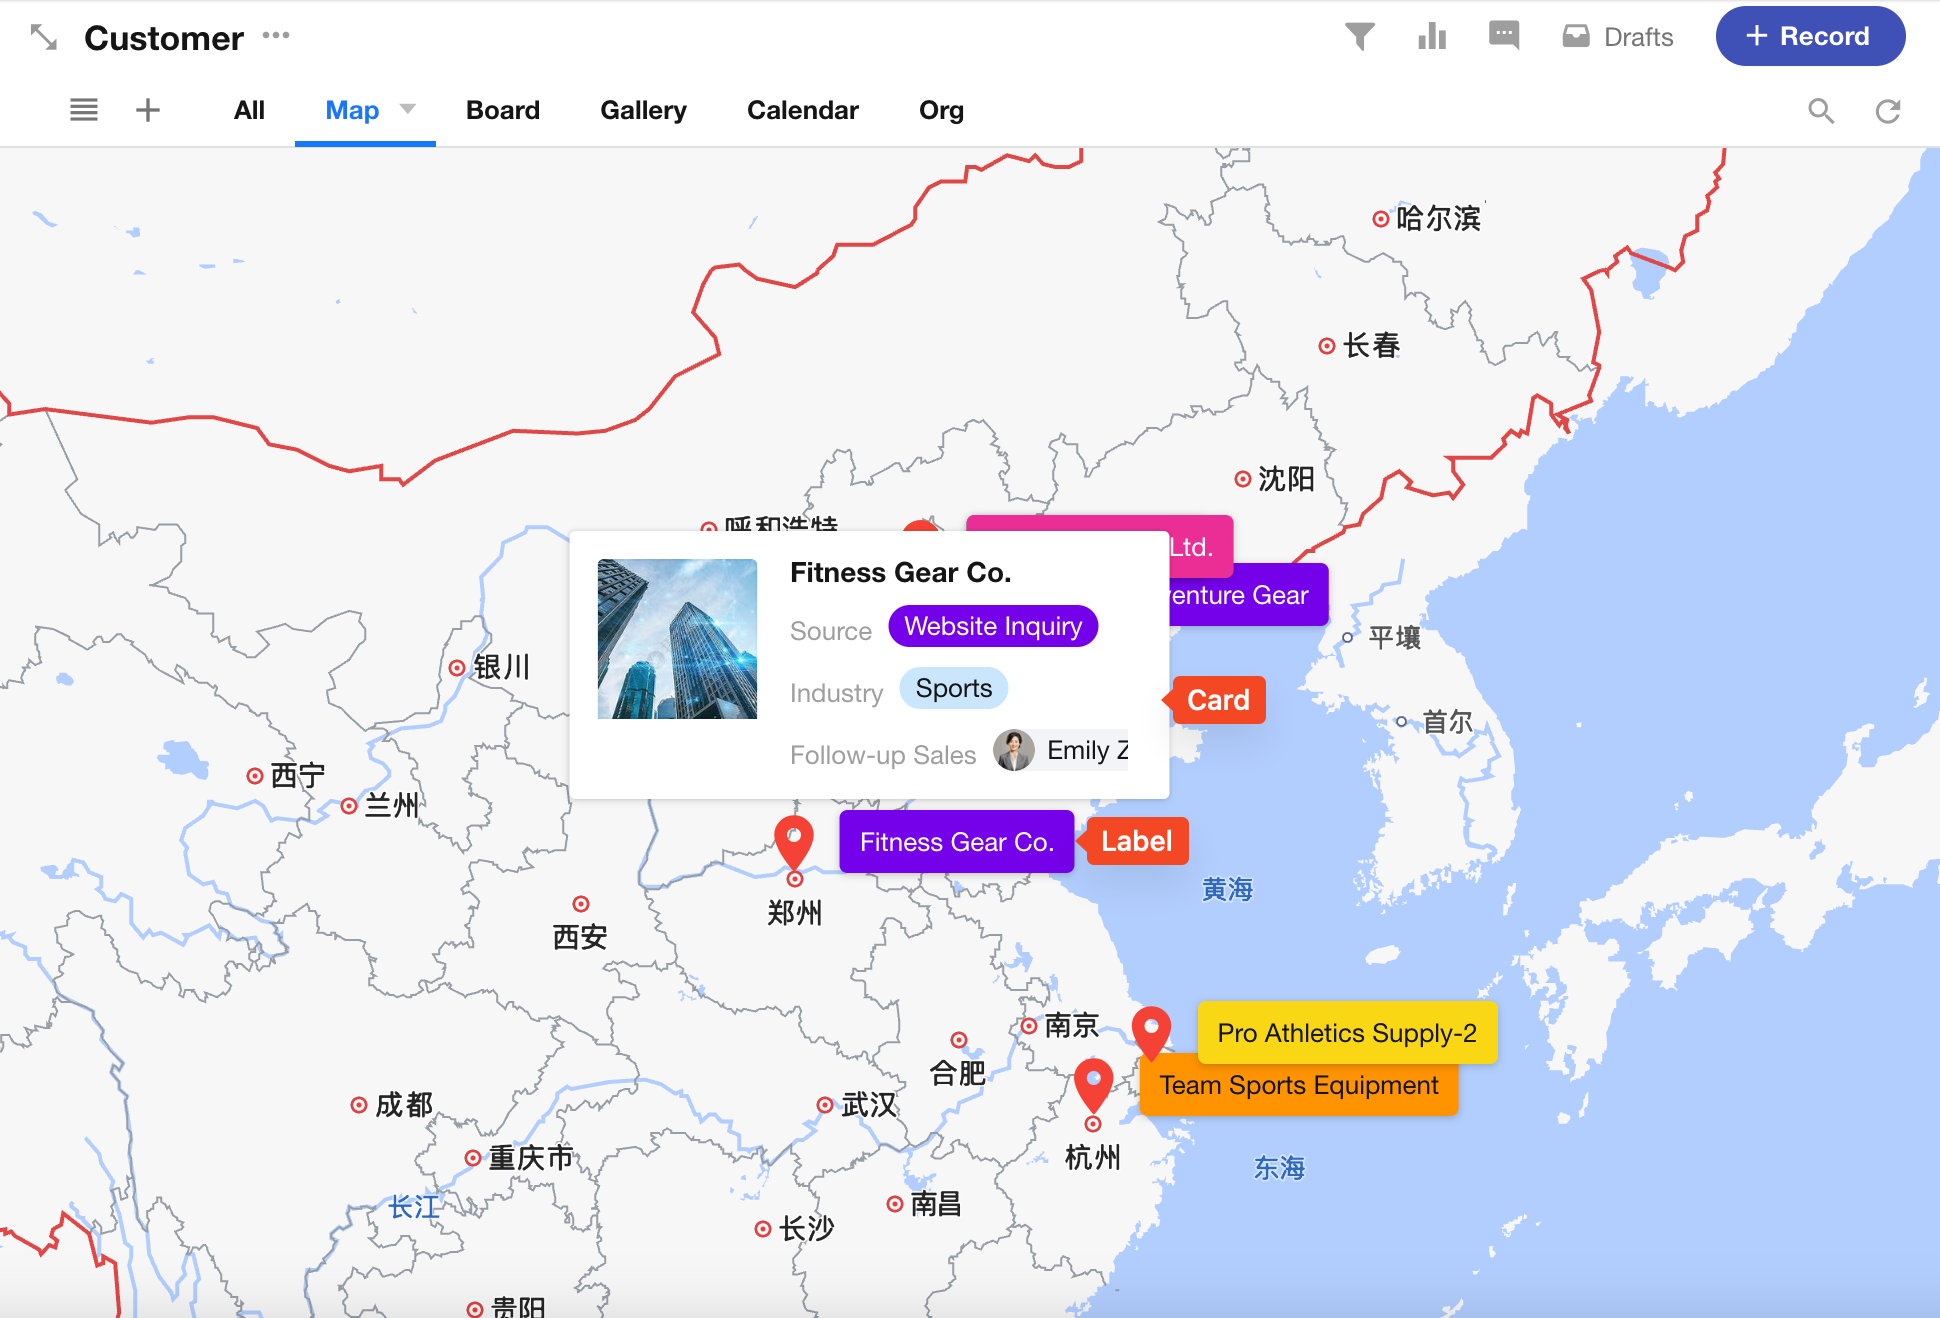
The card configuration includes:
See Card Settings in kanban View for more details.
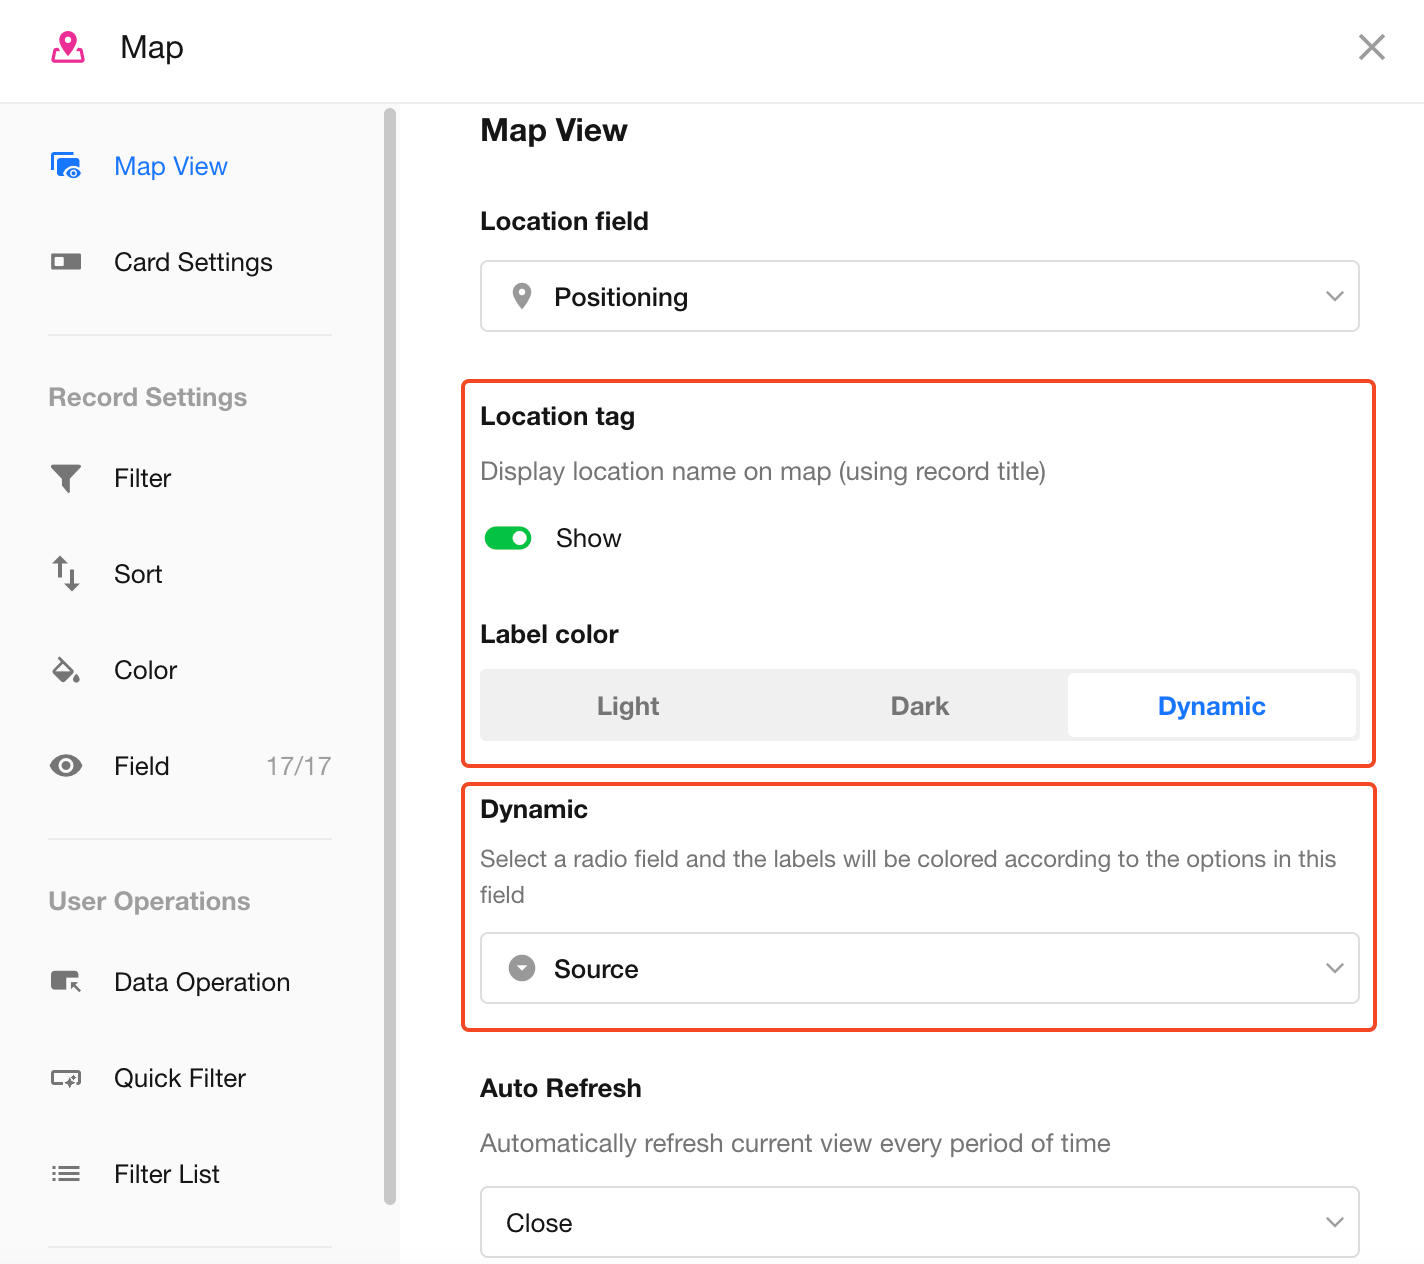
Label and Label Color
The label displays the title field of the record. When enabled, labels appear next to each location on the map.
Label color supports three modes: light, dark, and dynamic color.
If dynamic color is selected, you can designate a single-select field whose option color will be applied to the label.
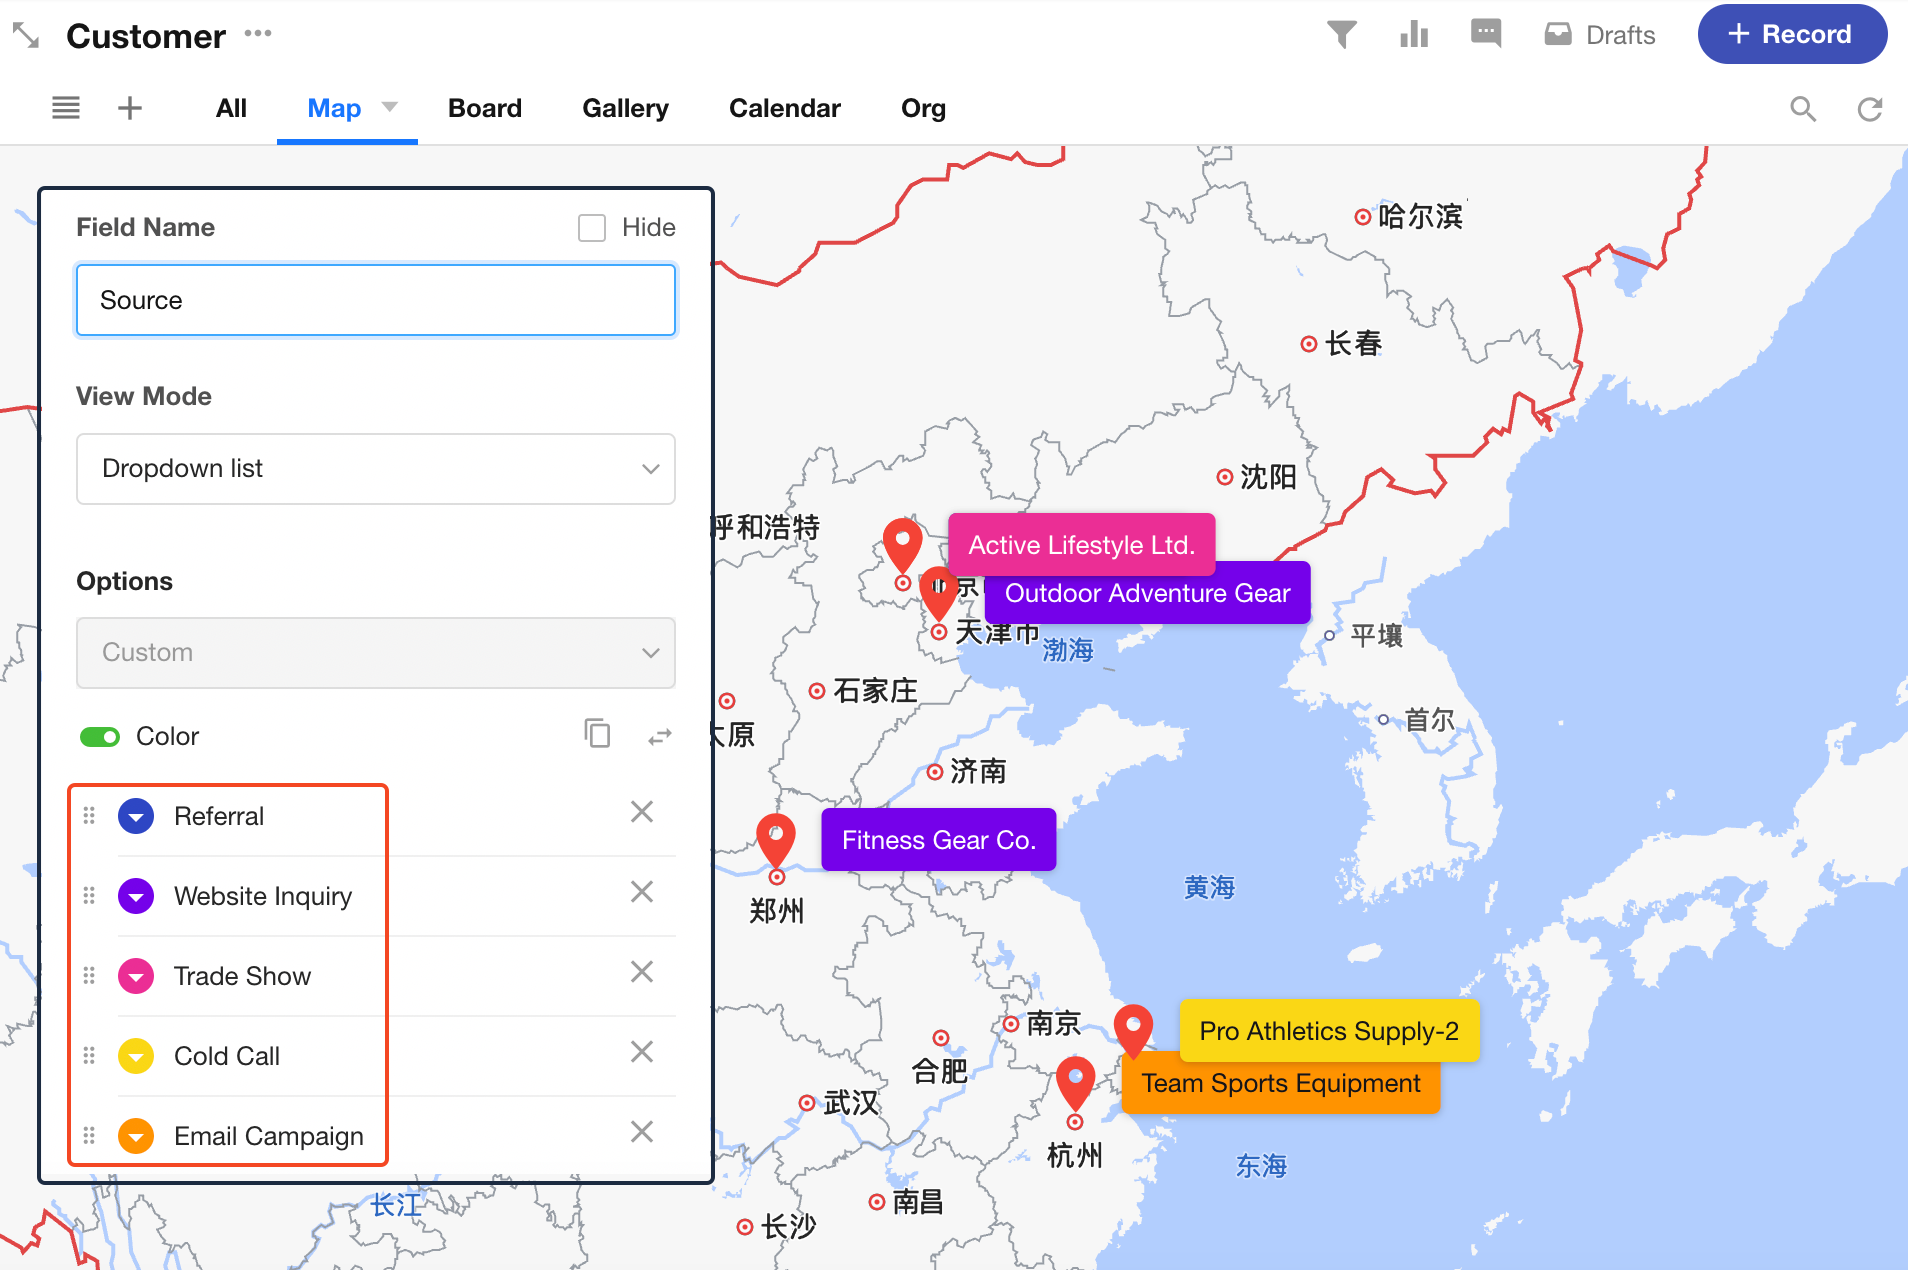
Location Icon and Card Color
You can also use a single-select field to control the color of both the location icon and the record card on the map.
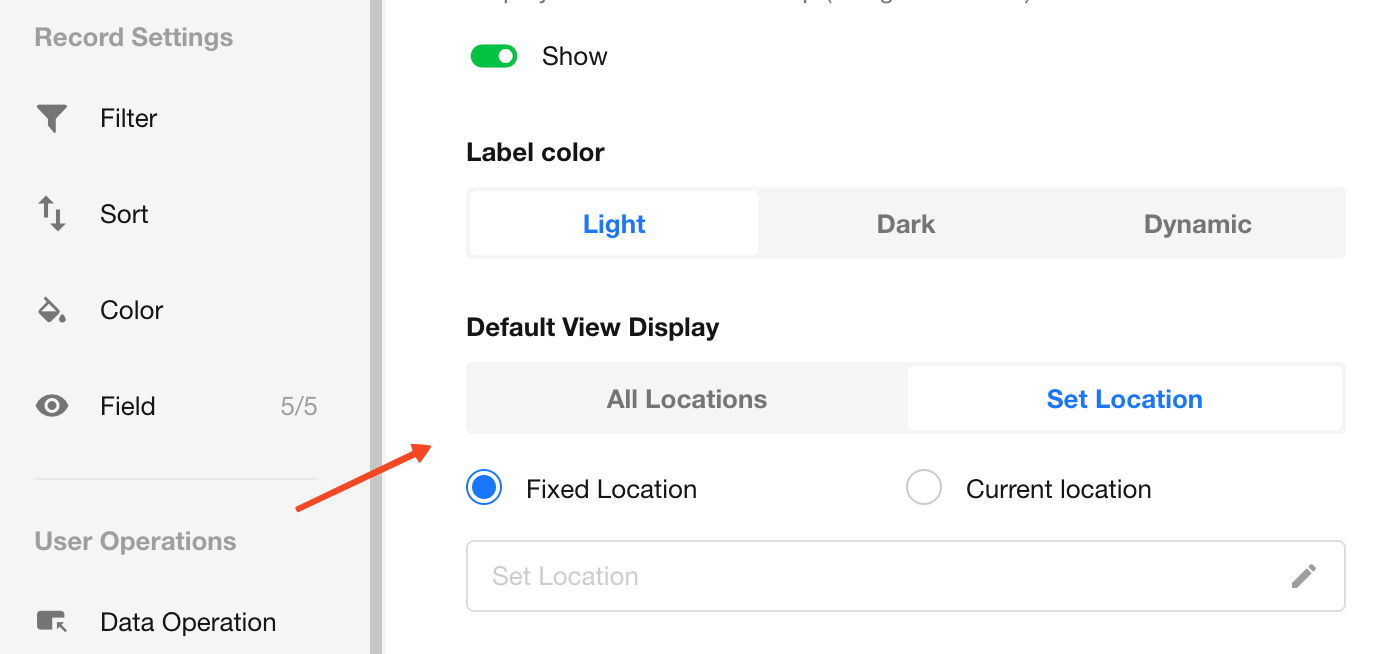
Default View Display
-
Show All Locations:
Automatically adjusts the zoom level to ensure all coordinates are visible within the map. -
Current Location:
Centers the map on the viewer’s current location. -
Fixed Location:
Sets a specific coordinate as the center of the map.
Tips
-
Data Limit:
The map view renders up to 200 records. If there are more than 200 records, use sorting rules to prioritize which records are displayed. -
Enhance Label Information:
To display more details in map labels, consider using a concat field to combine multiple fields, and set it as the title field.
Was this document helpful?