Gantt View
Overview
Gantt View: A Gantt chart, also known as a bar chart, is used to visualize projects, timelines, and other time-related activities through horizontal bars.
In a Gantt view, the horizontal axis represents time, while the vertical axis lists data records (tasks or activities). Each record is displayed as a horizontal bar, where the position and length indicate the start/end date, duration, and sequential relationship between tasks.
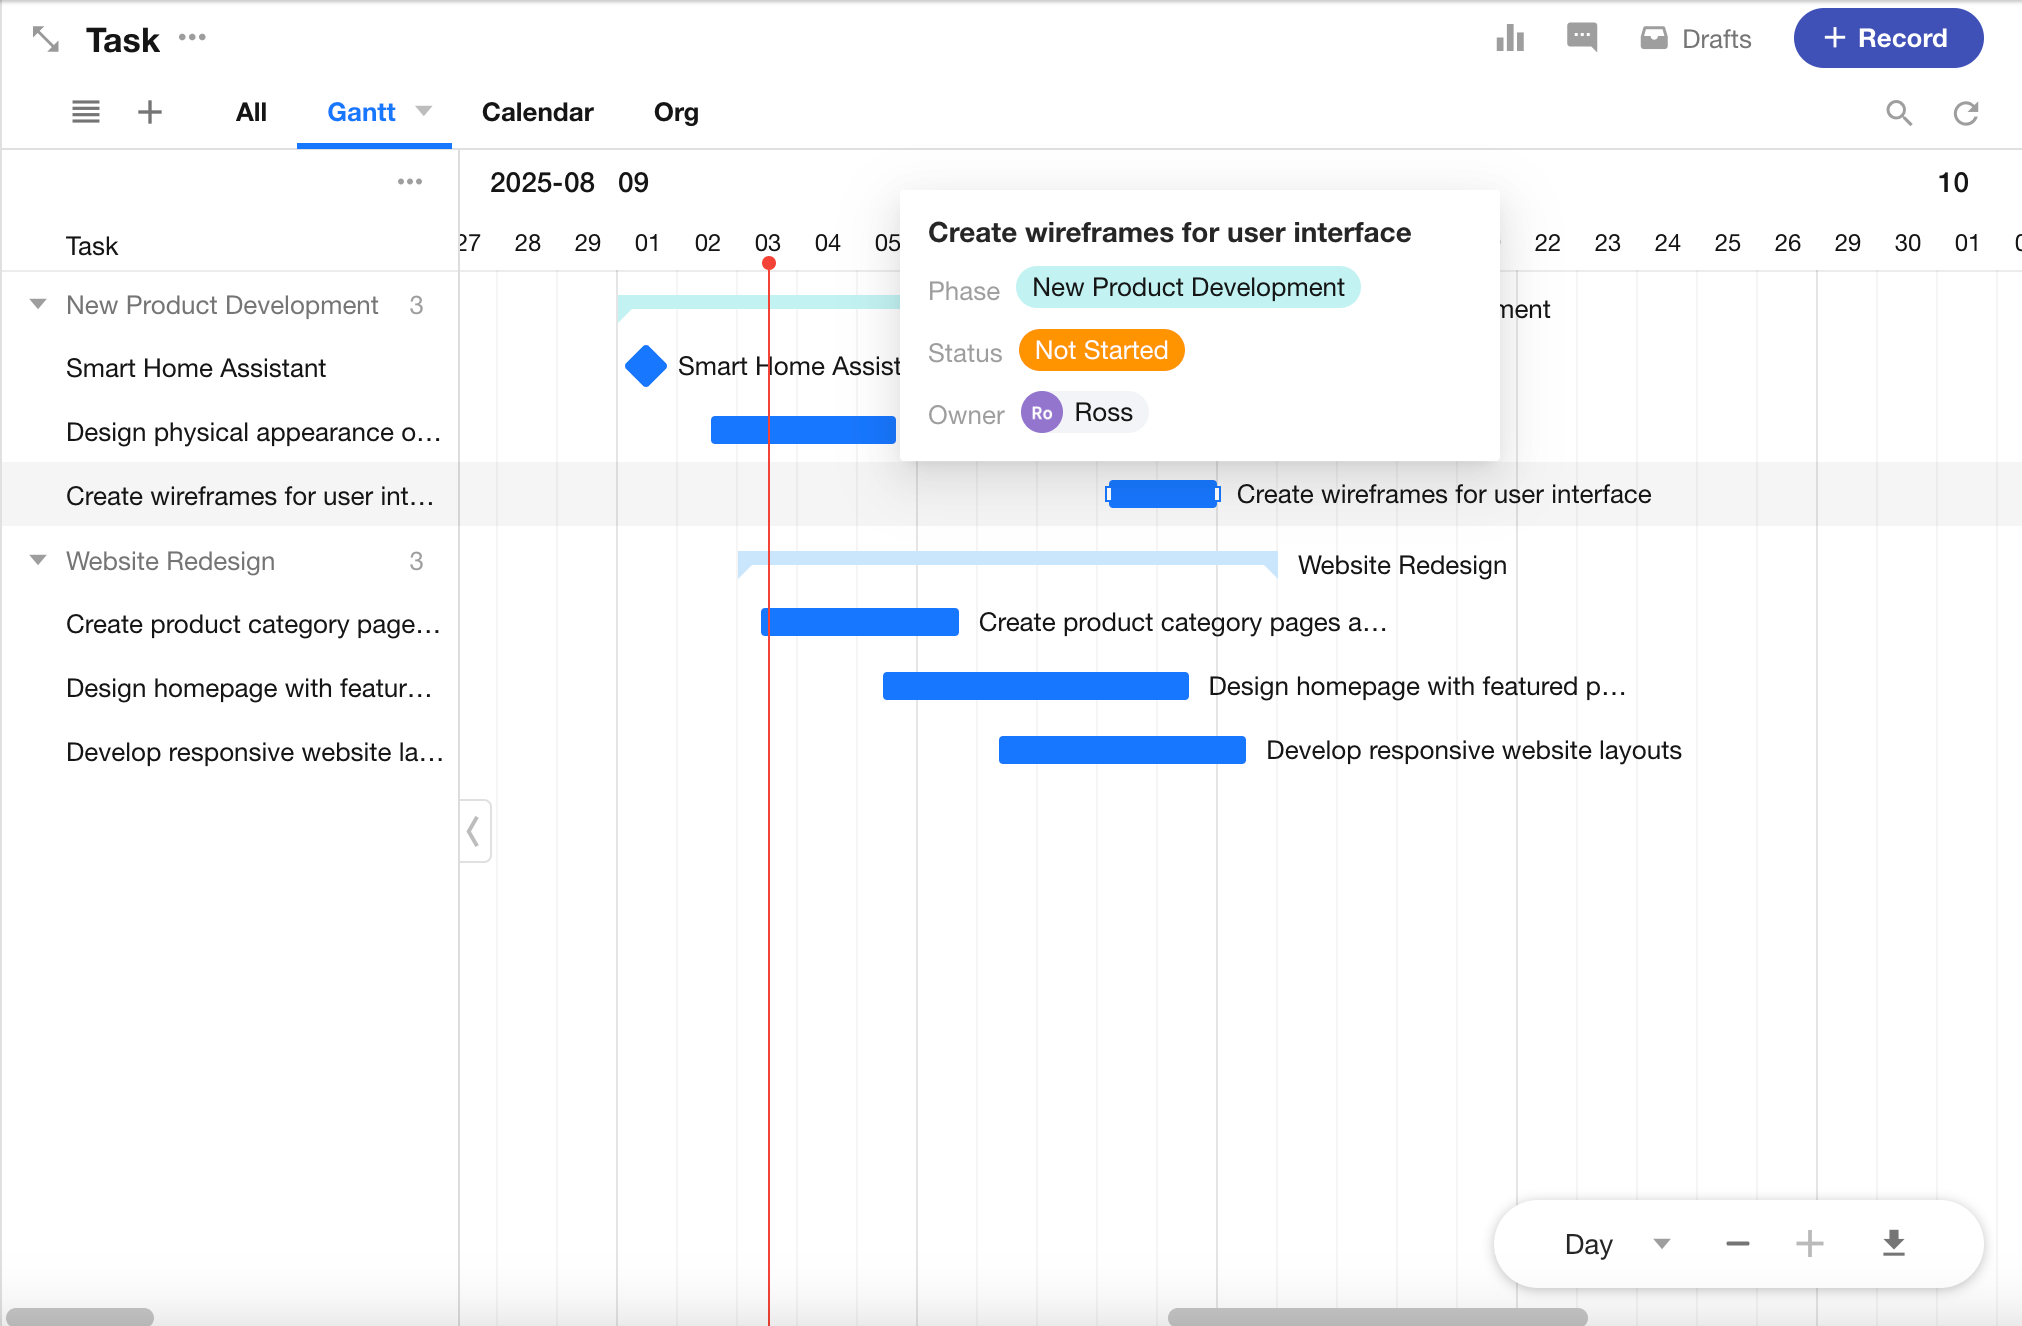
Gantt charts are commonly used for project timelines and construction schedules. With Gantt view, you can easily see:
- The project start and end dates
- All listed tasks
- When each task starts, ends, and how long it lasts
- How tasks are connected or overlap
Getting Started
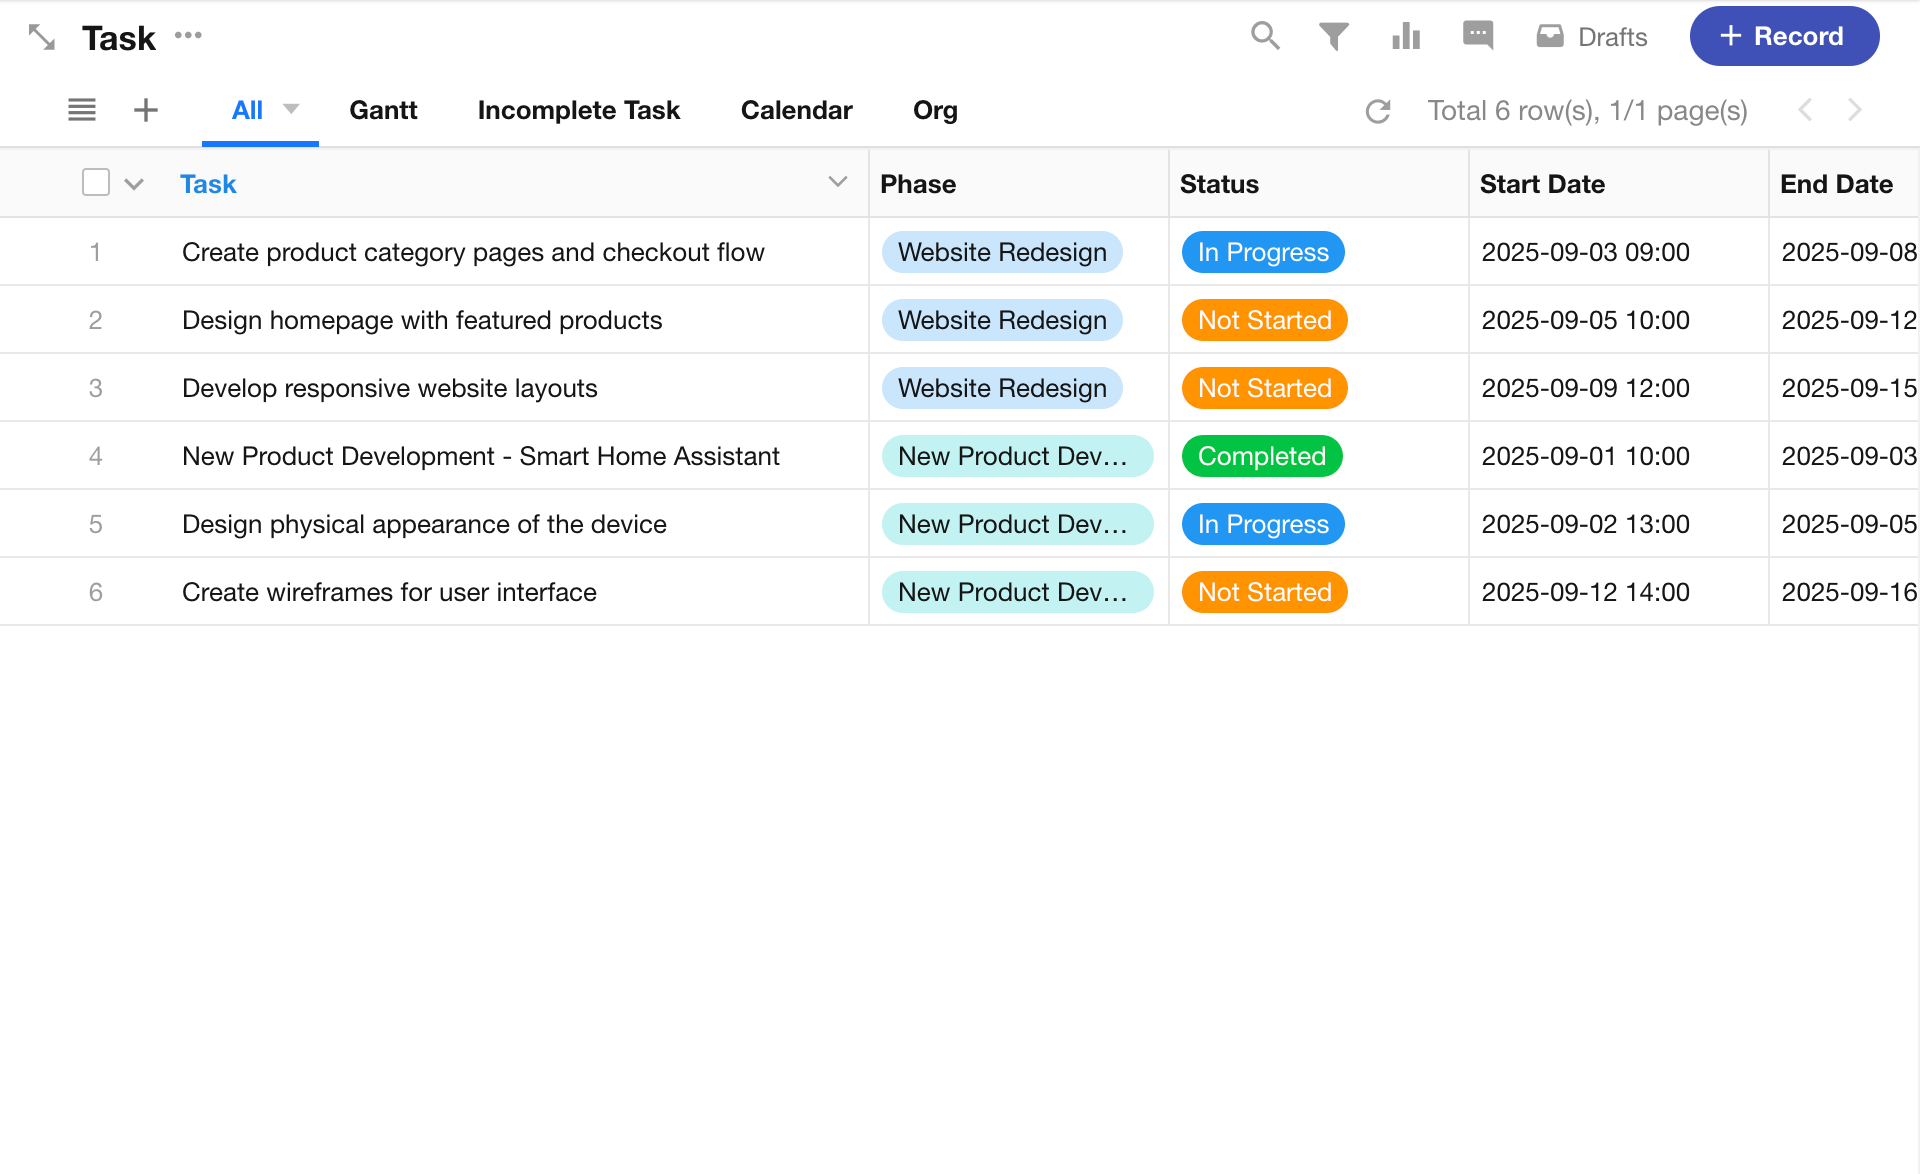
First, create a Task Worksheet with the following essential fields:
| Field | Field Type |
|---|---|
| Task Name | Text |
| Start Date | Date |
| End Date | Date |
| Phase | Single Select |
| Status | Single Select |
| Owner | Members |
Add several records to populate the worksheet.
Create a Gantt View
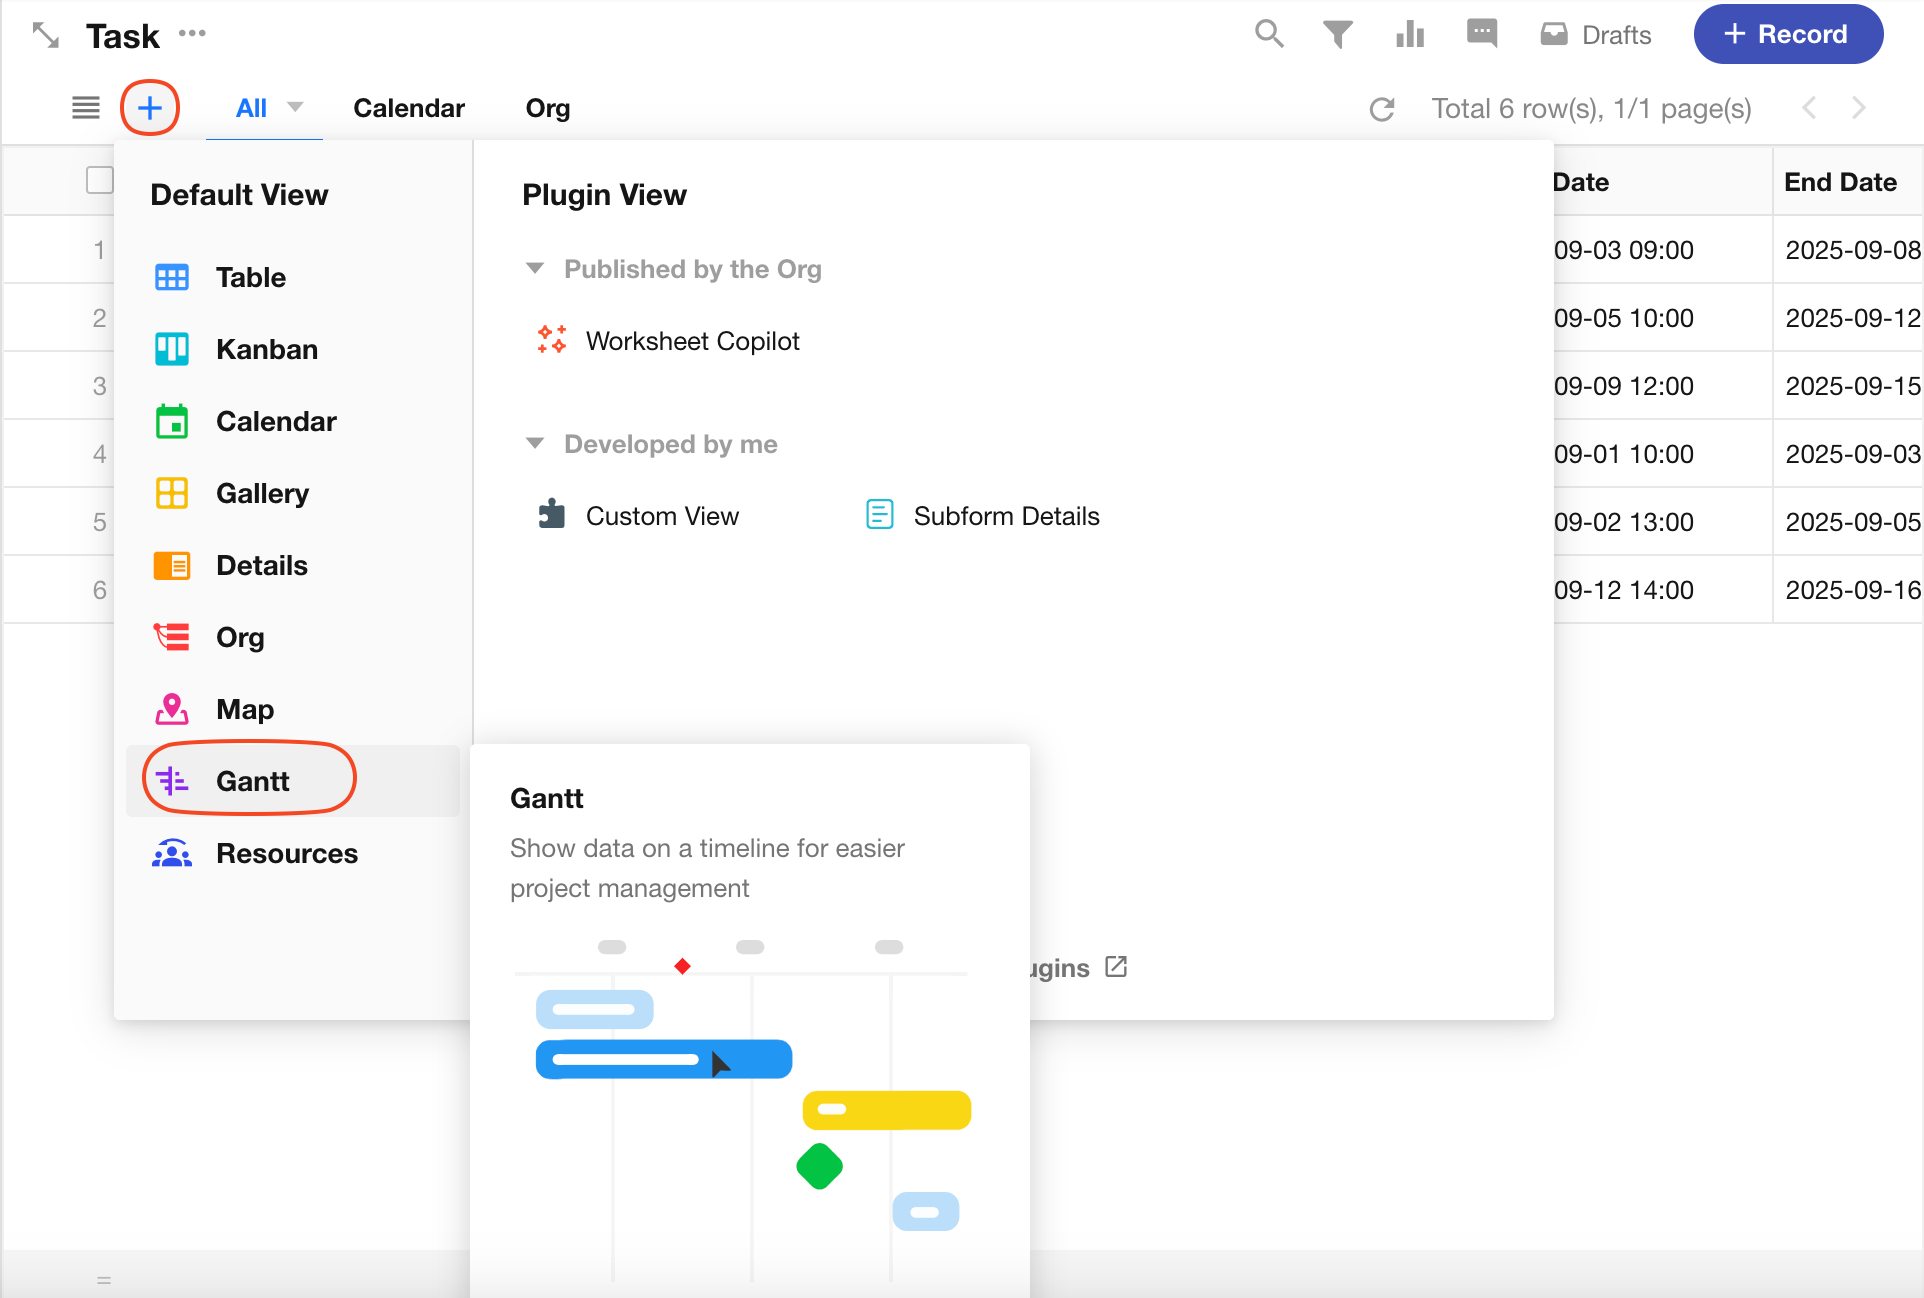
1. Add a New View and Select “Gantt View”
2. Select Start Date and End Date Fields

3. View Layout
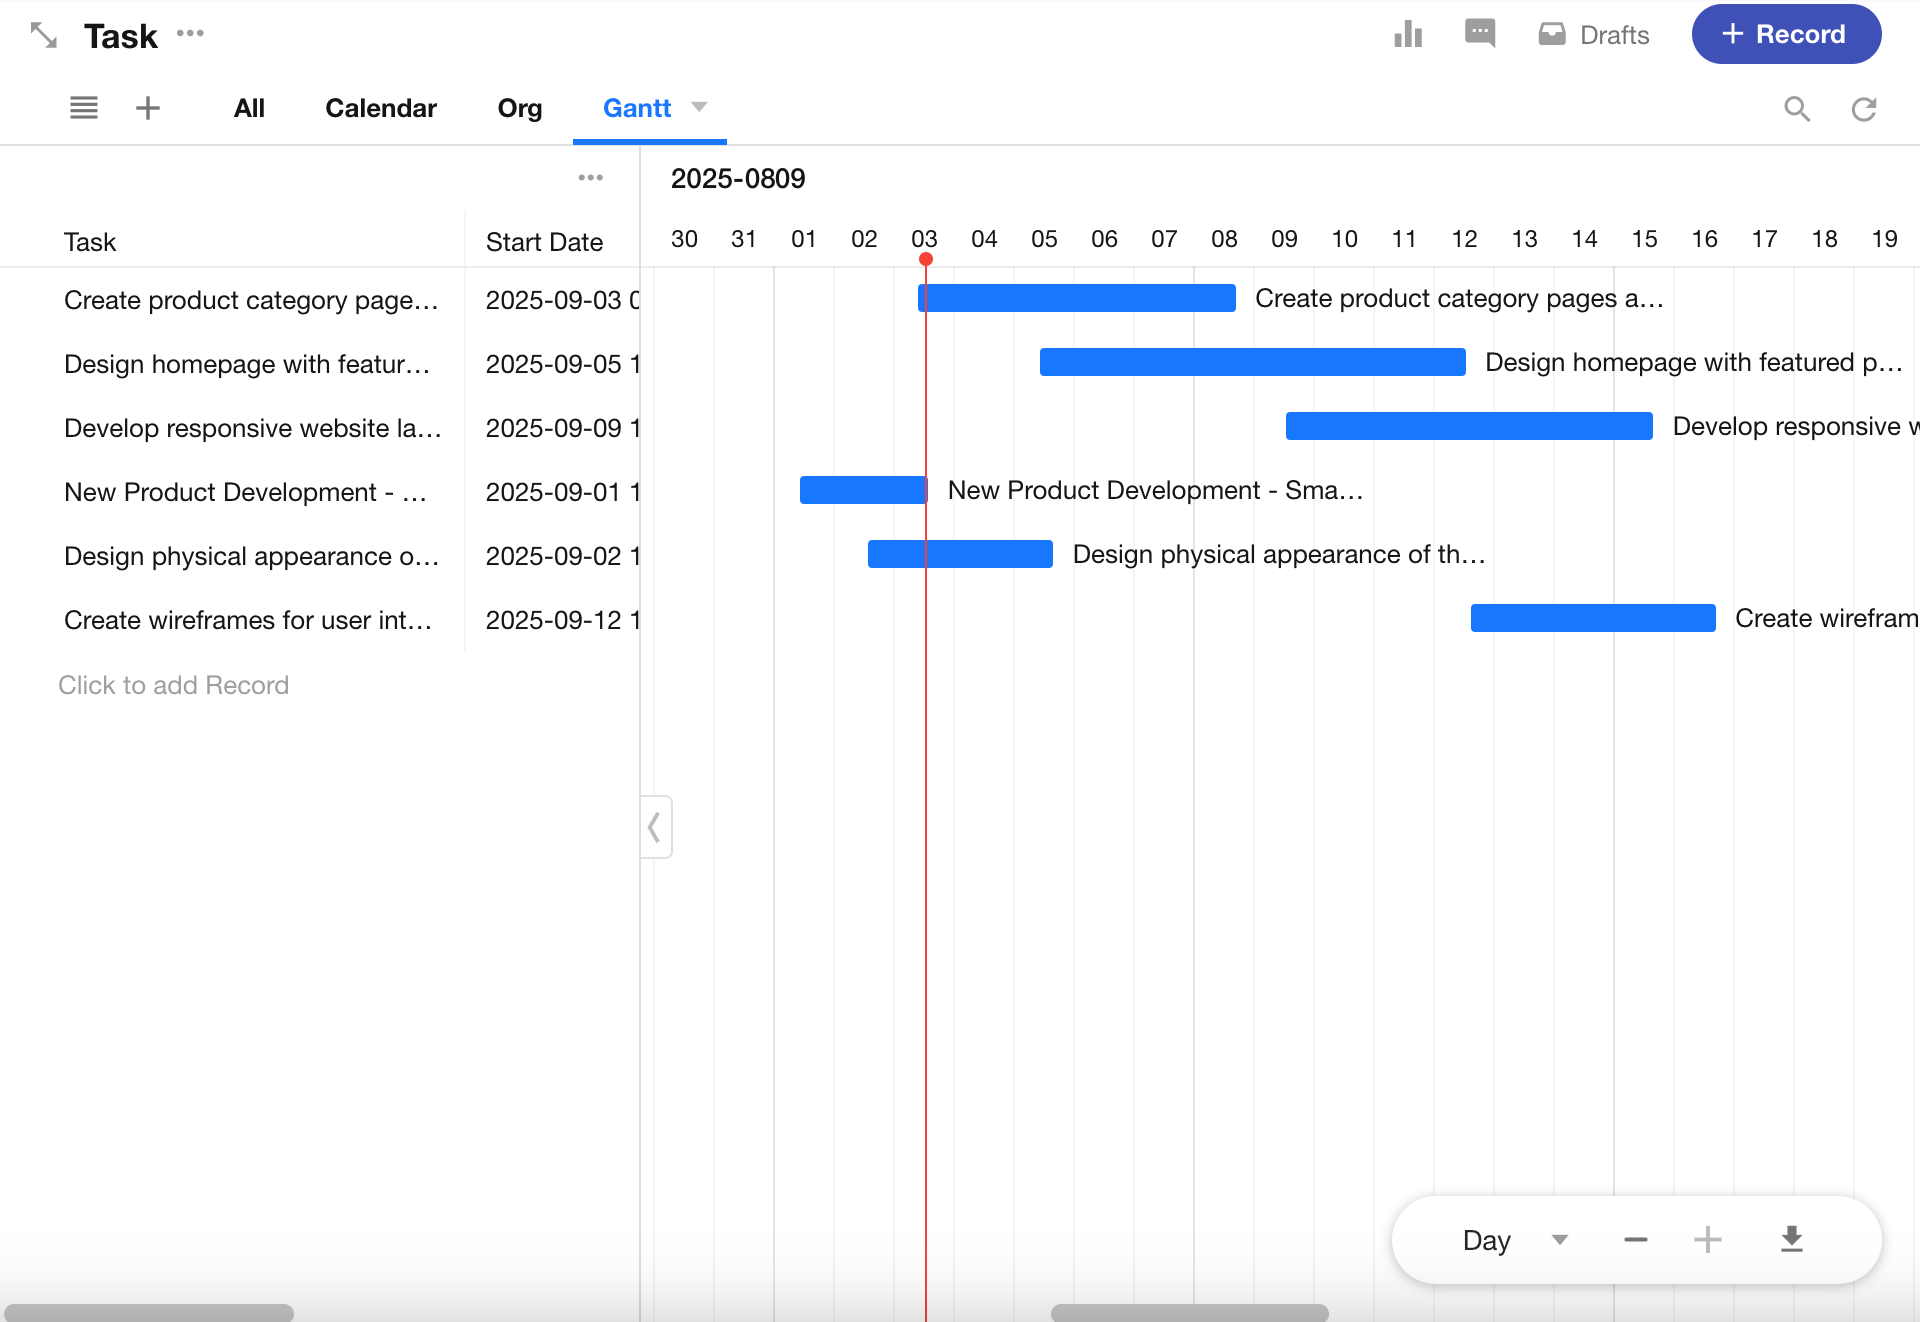
The left panel displays the list of records (tasks), while the right panel shows the timeline bars.
- By default, the left list shows the title field, start date, end date, and duration.
- The left and right edges of a bar represent the start and end dates.
- The length of the bar indicates task duration.
- A red line marks today's date.
View Settings
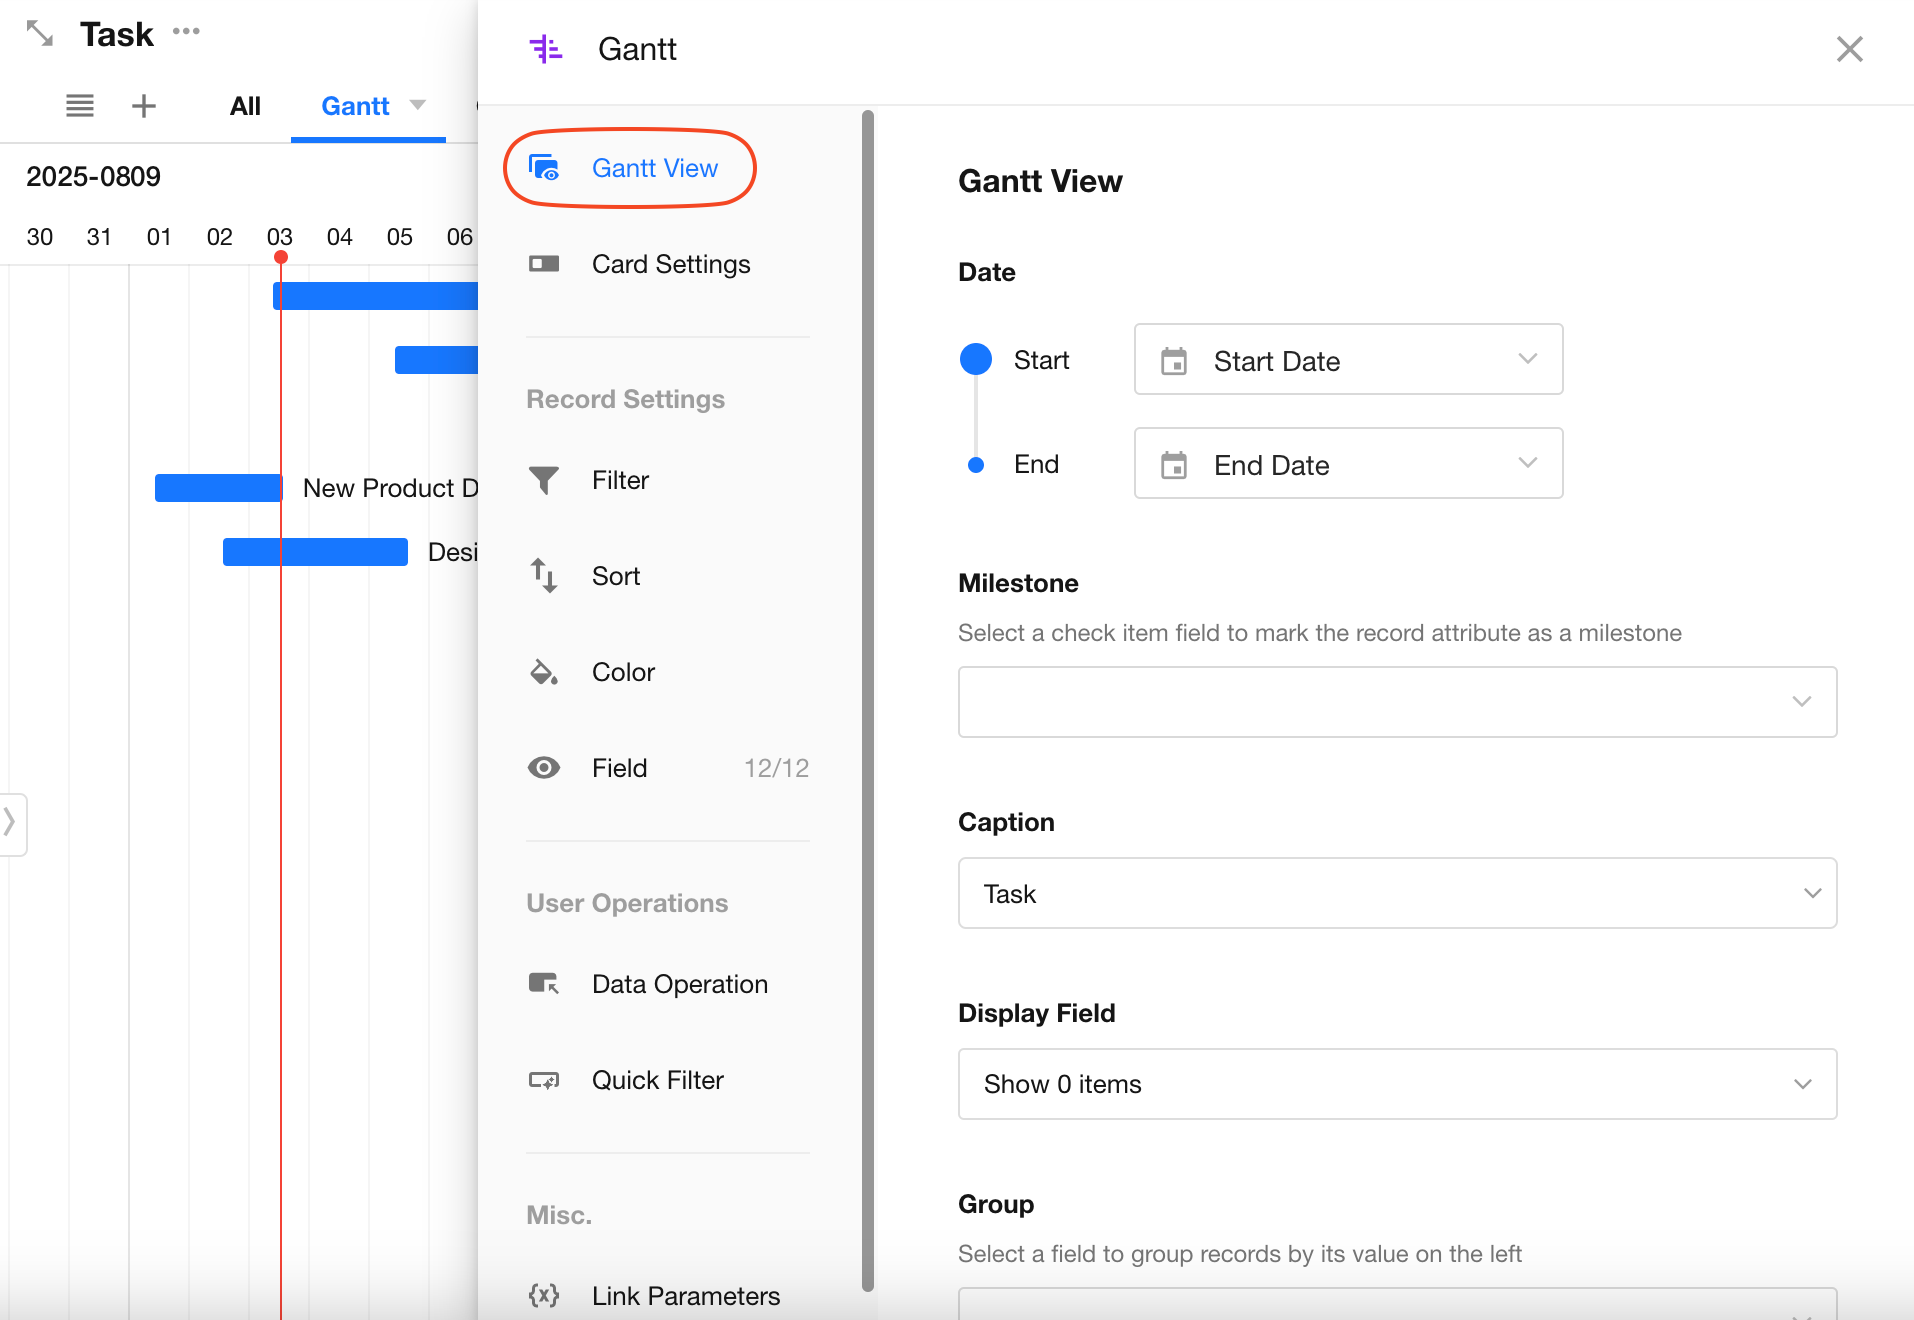
1. Start/End Date Fields
You can modify the base date fields to define the bars in the Gantt view using start and end date fields.
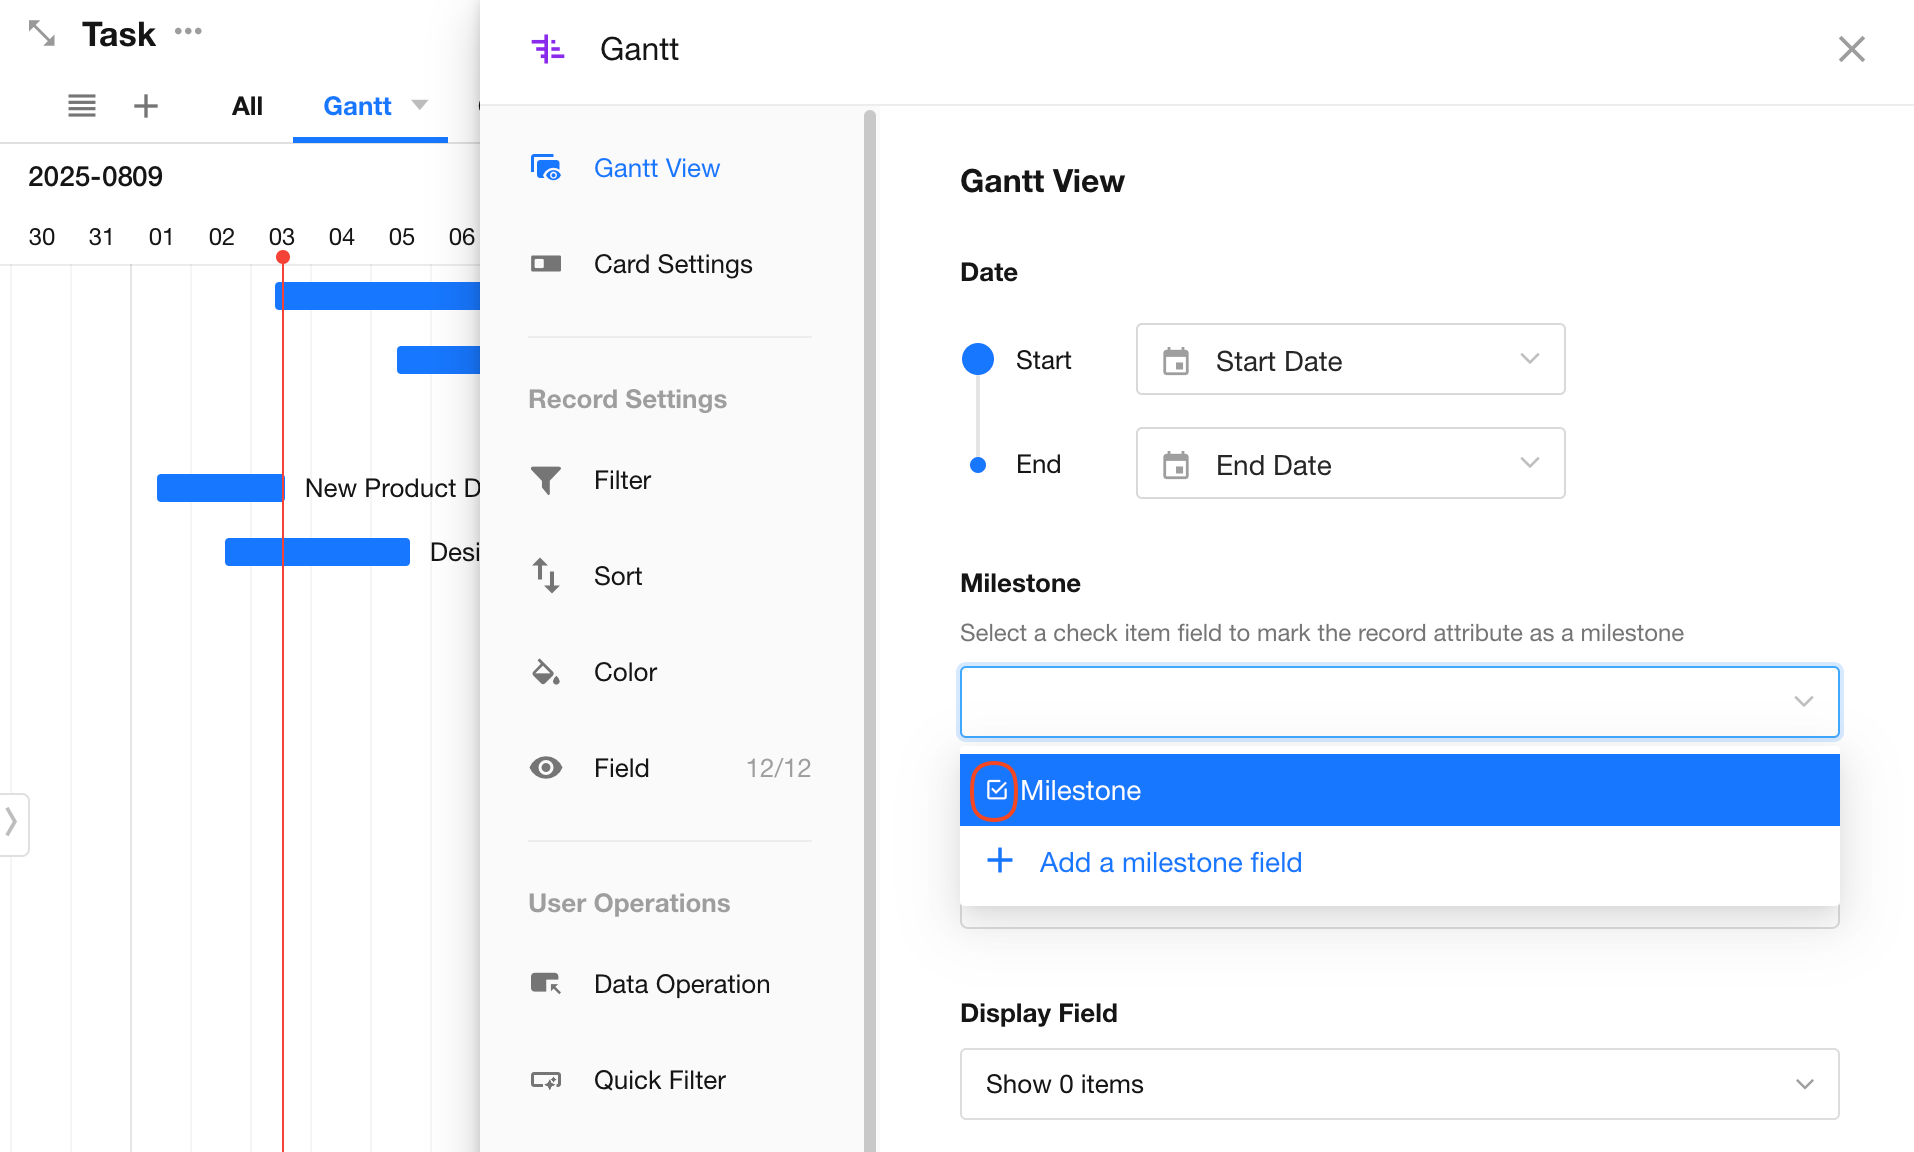
2. Milestone
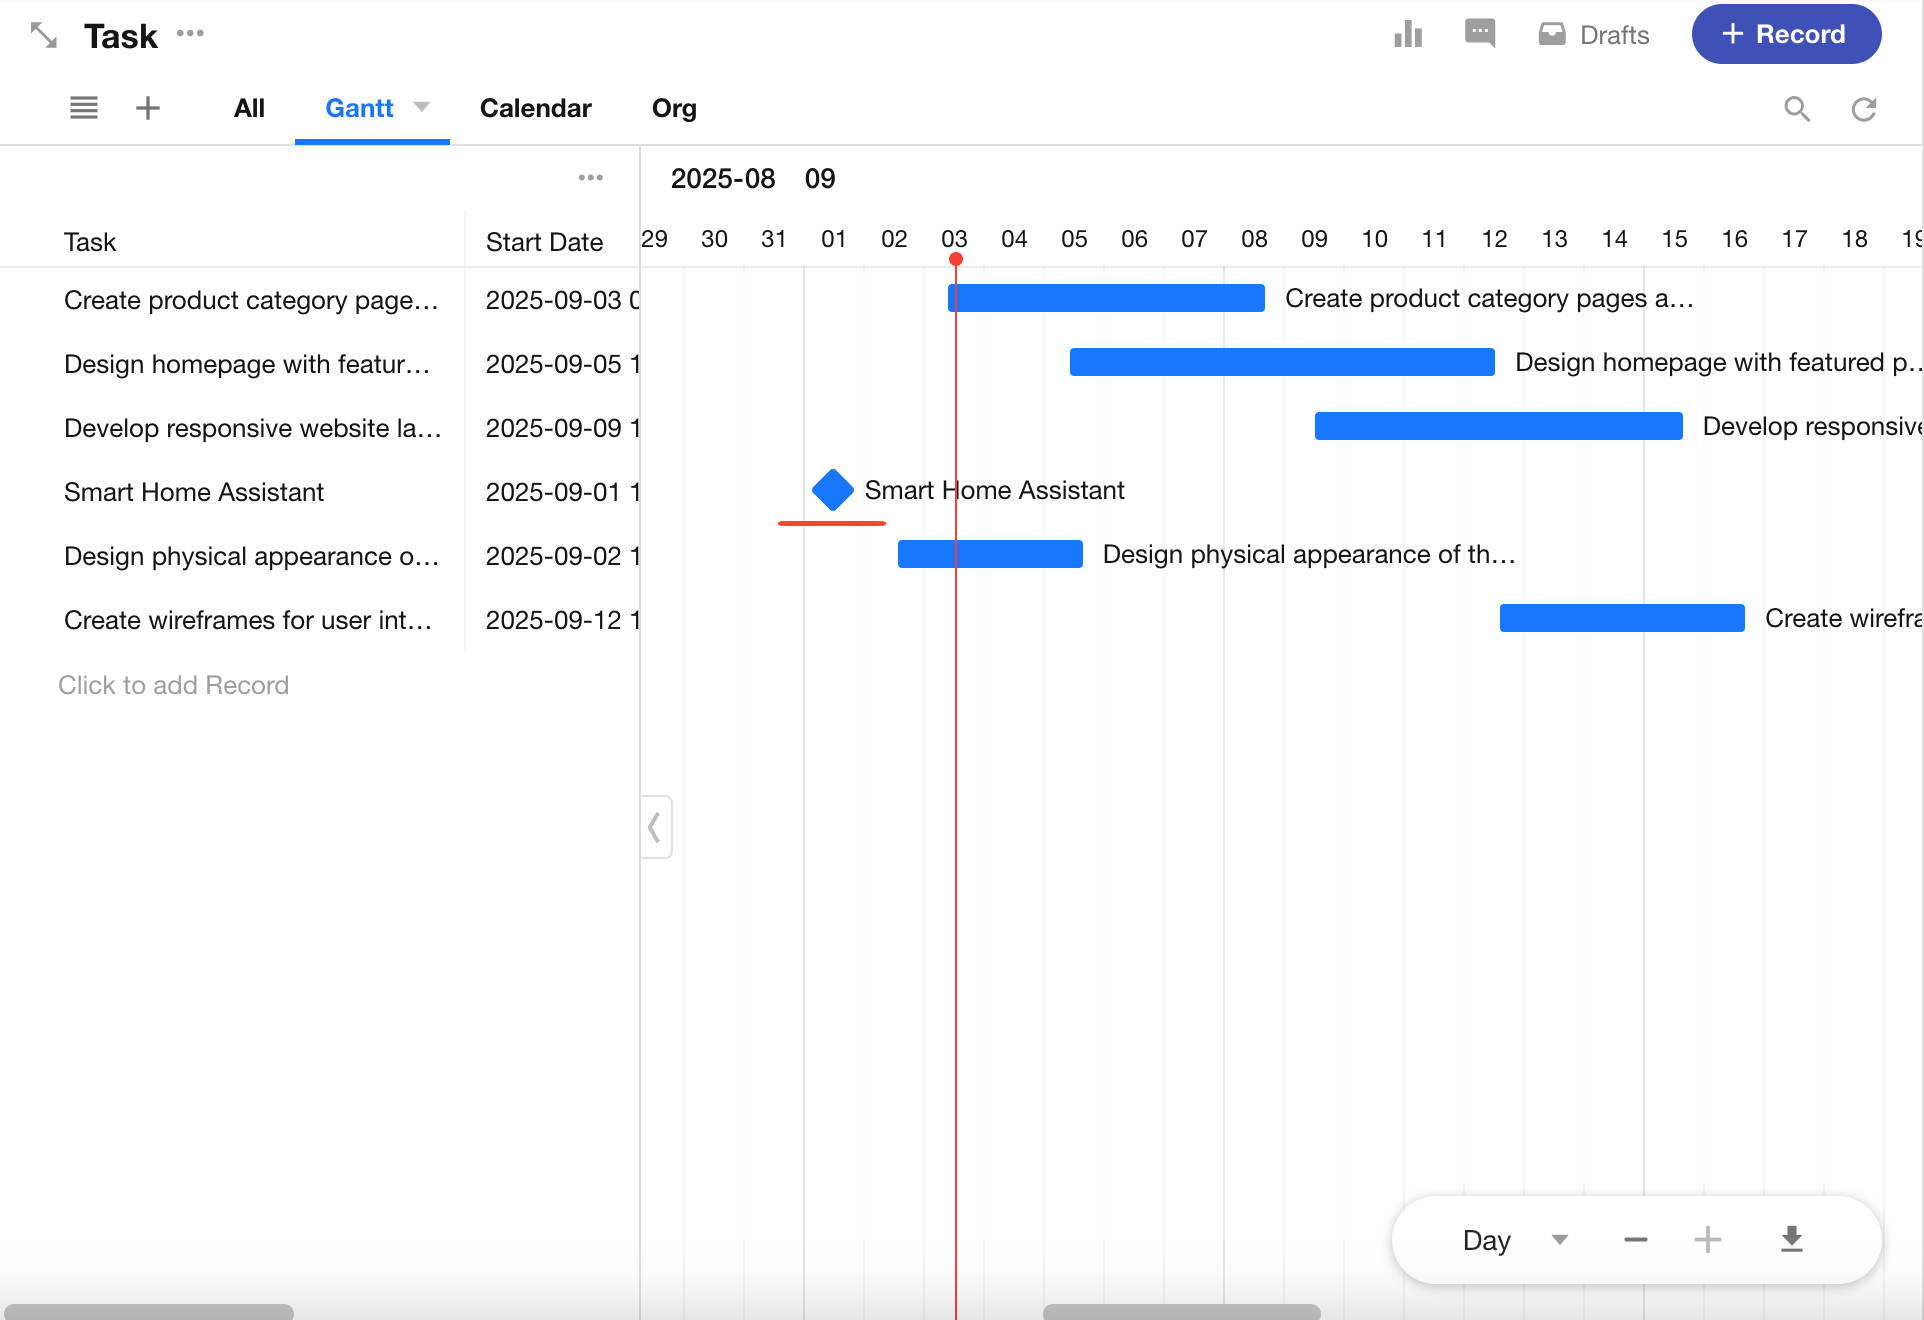
Milestones represent key events without duration. For instance, a "Software Requirements Document" submission can be treated as a milestone.
Select a check item field to indicate whether a task is a milestone. If the field doesn't exist, you can create one.
Milestone Example:
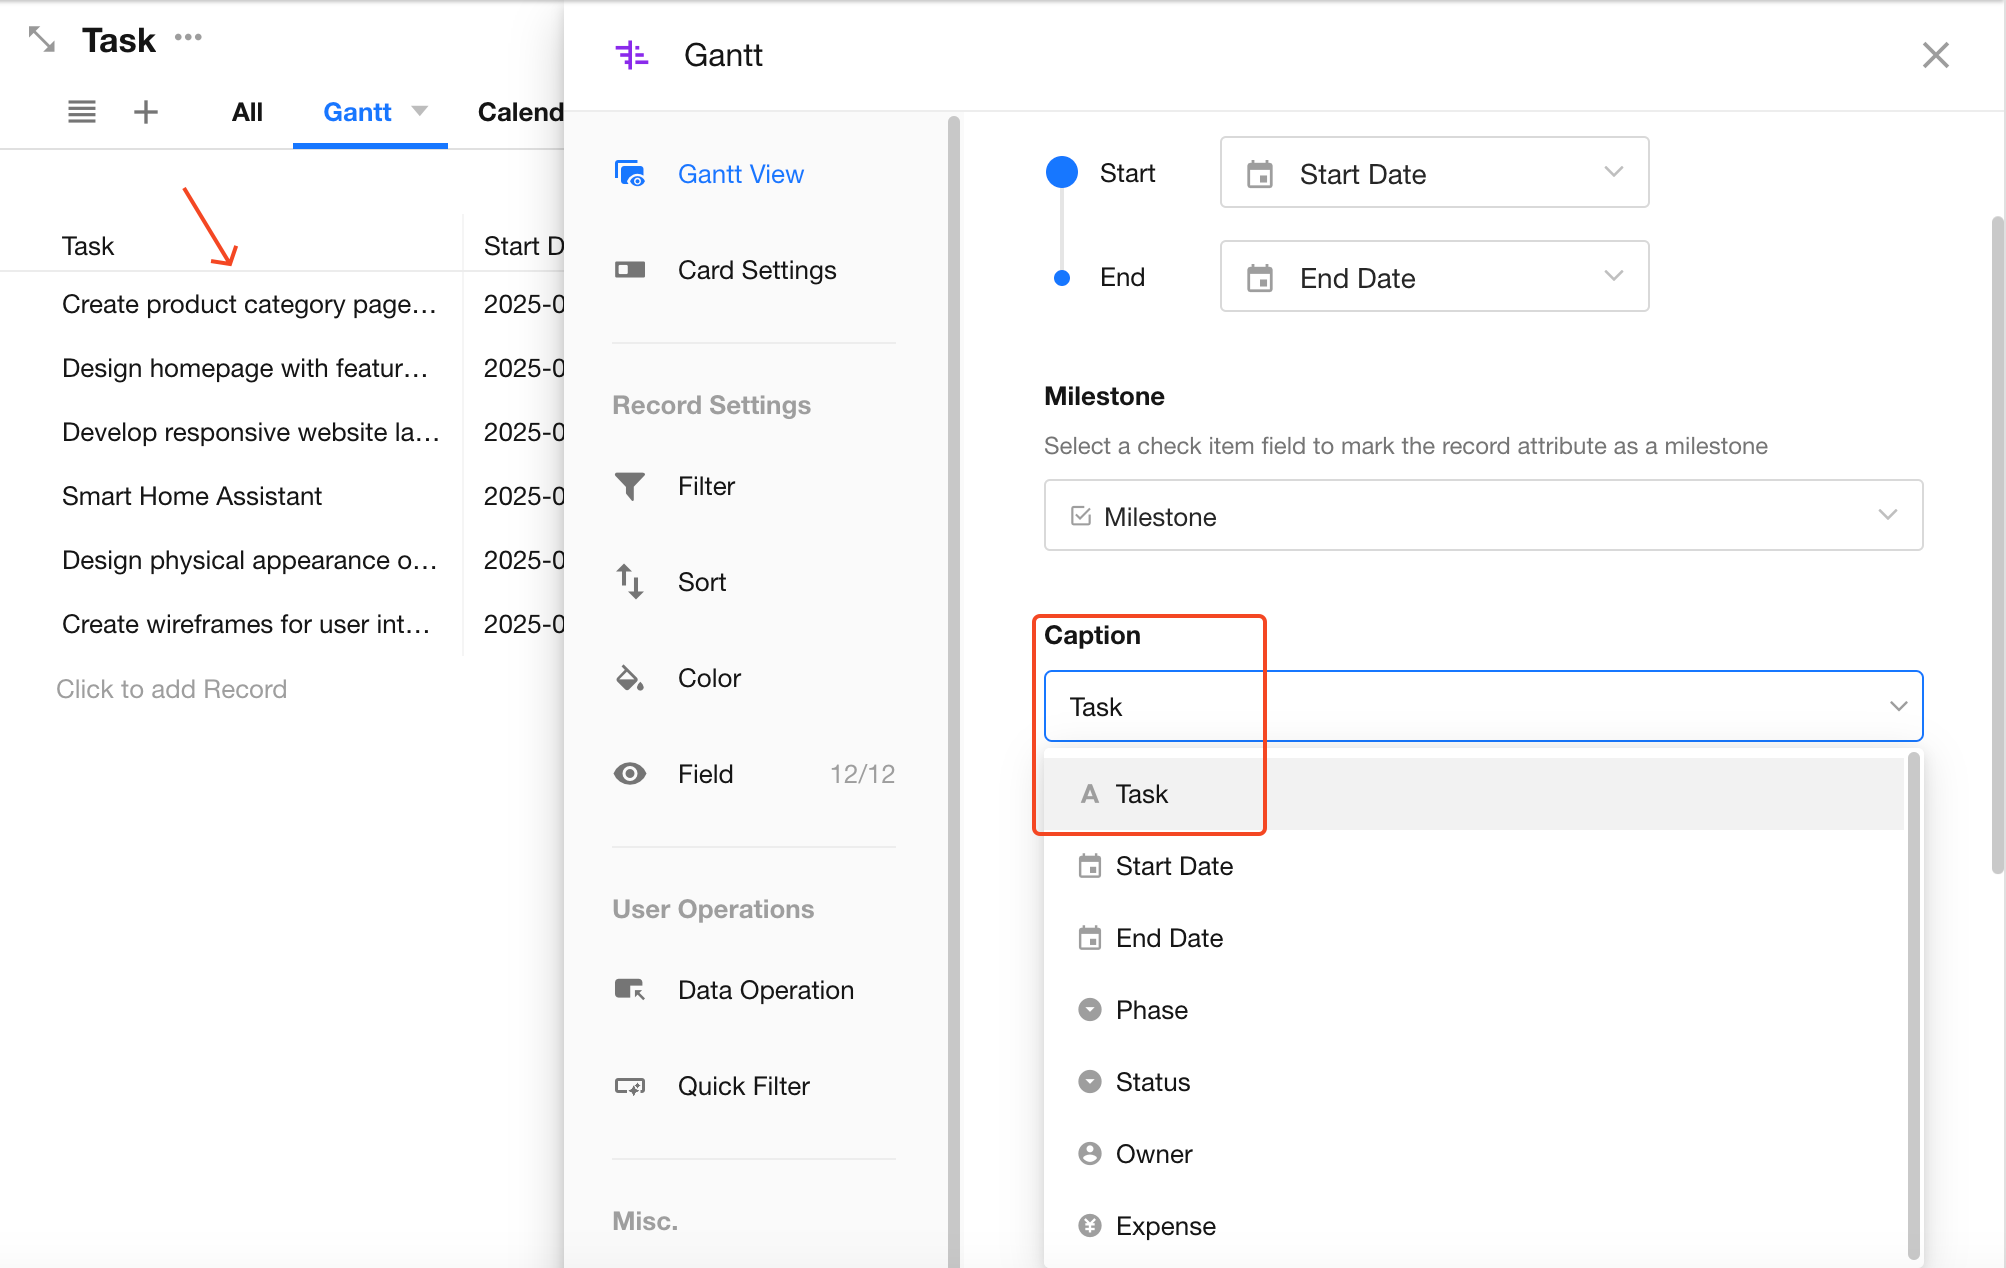
3. Title
Select the title to display in the left-hand list. Default is the record's title field.
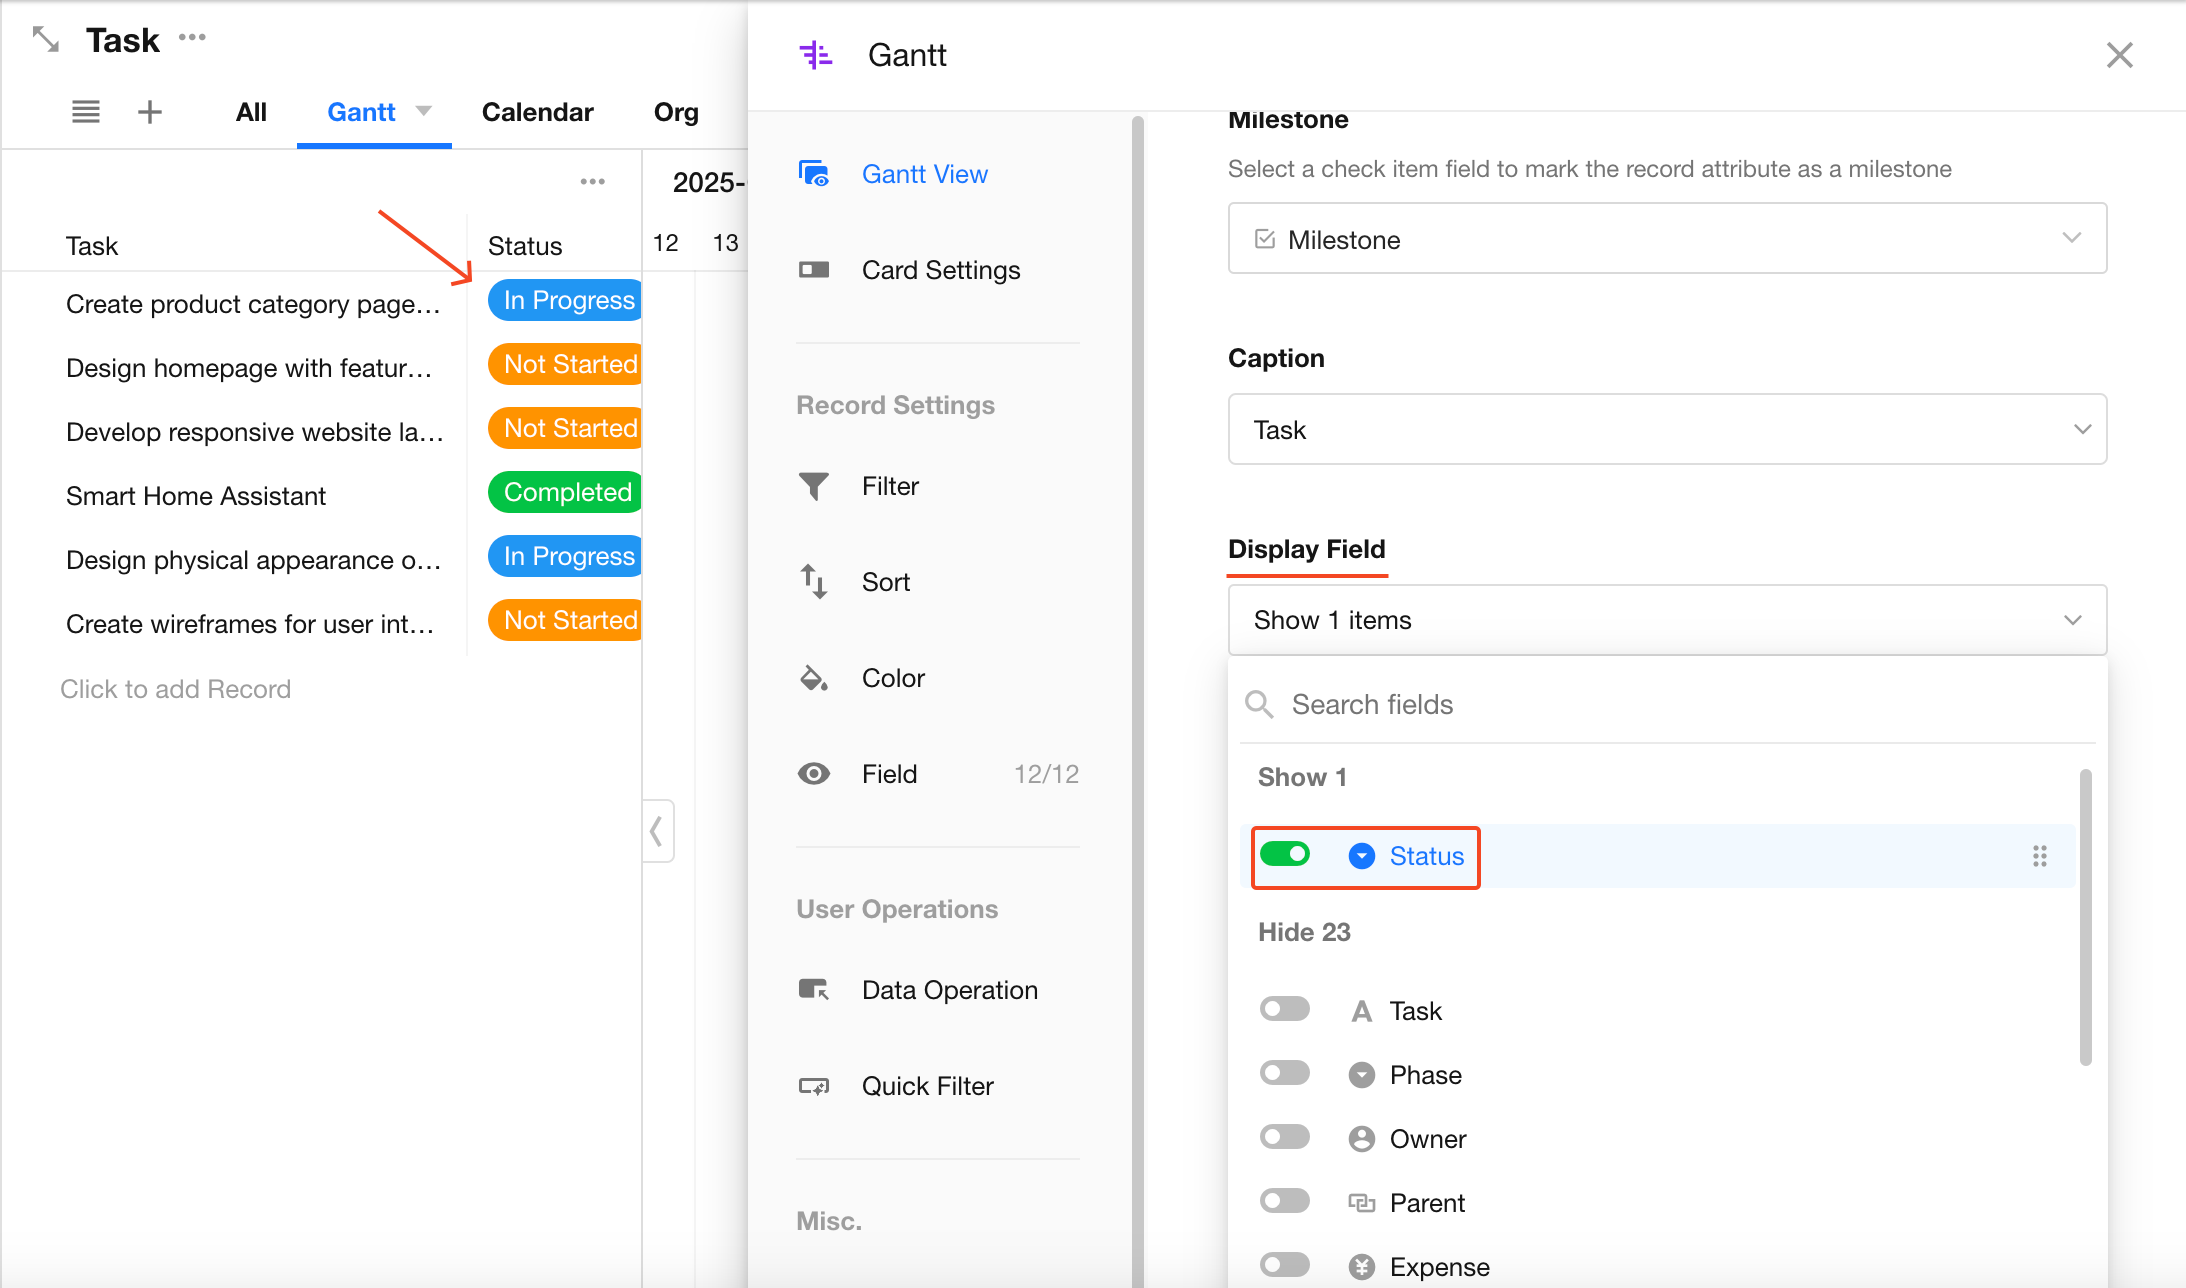
4. Display Fields
Additional fields can be shown in the left record list.
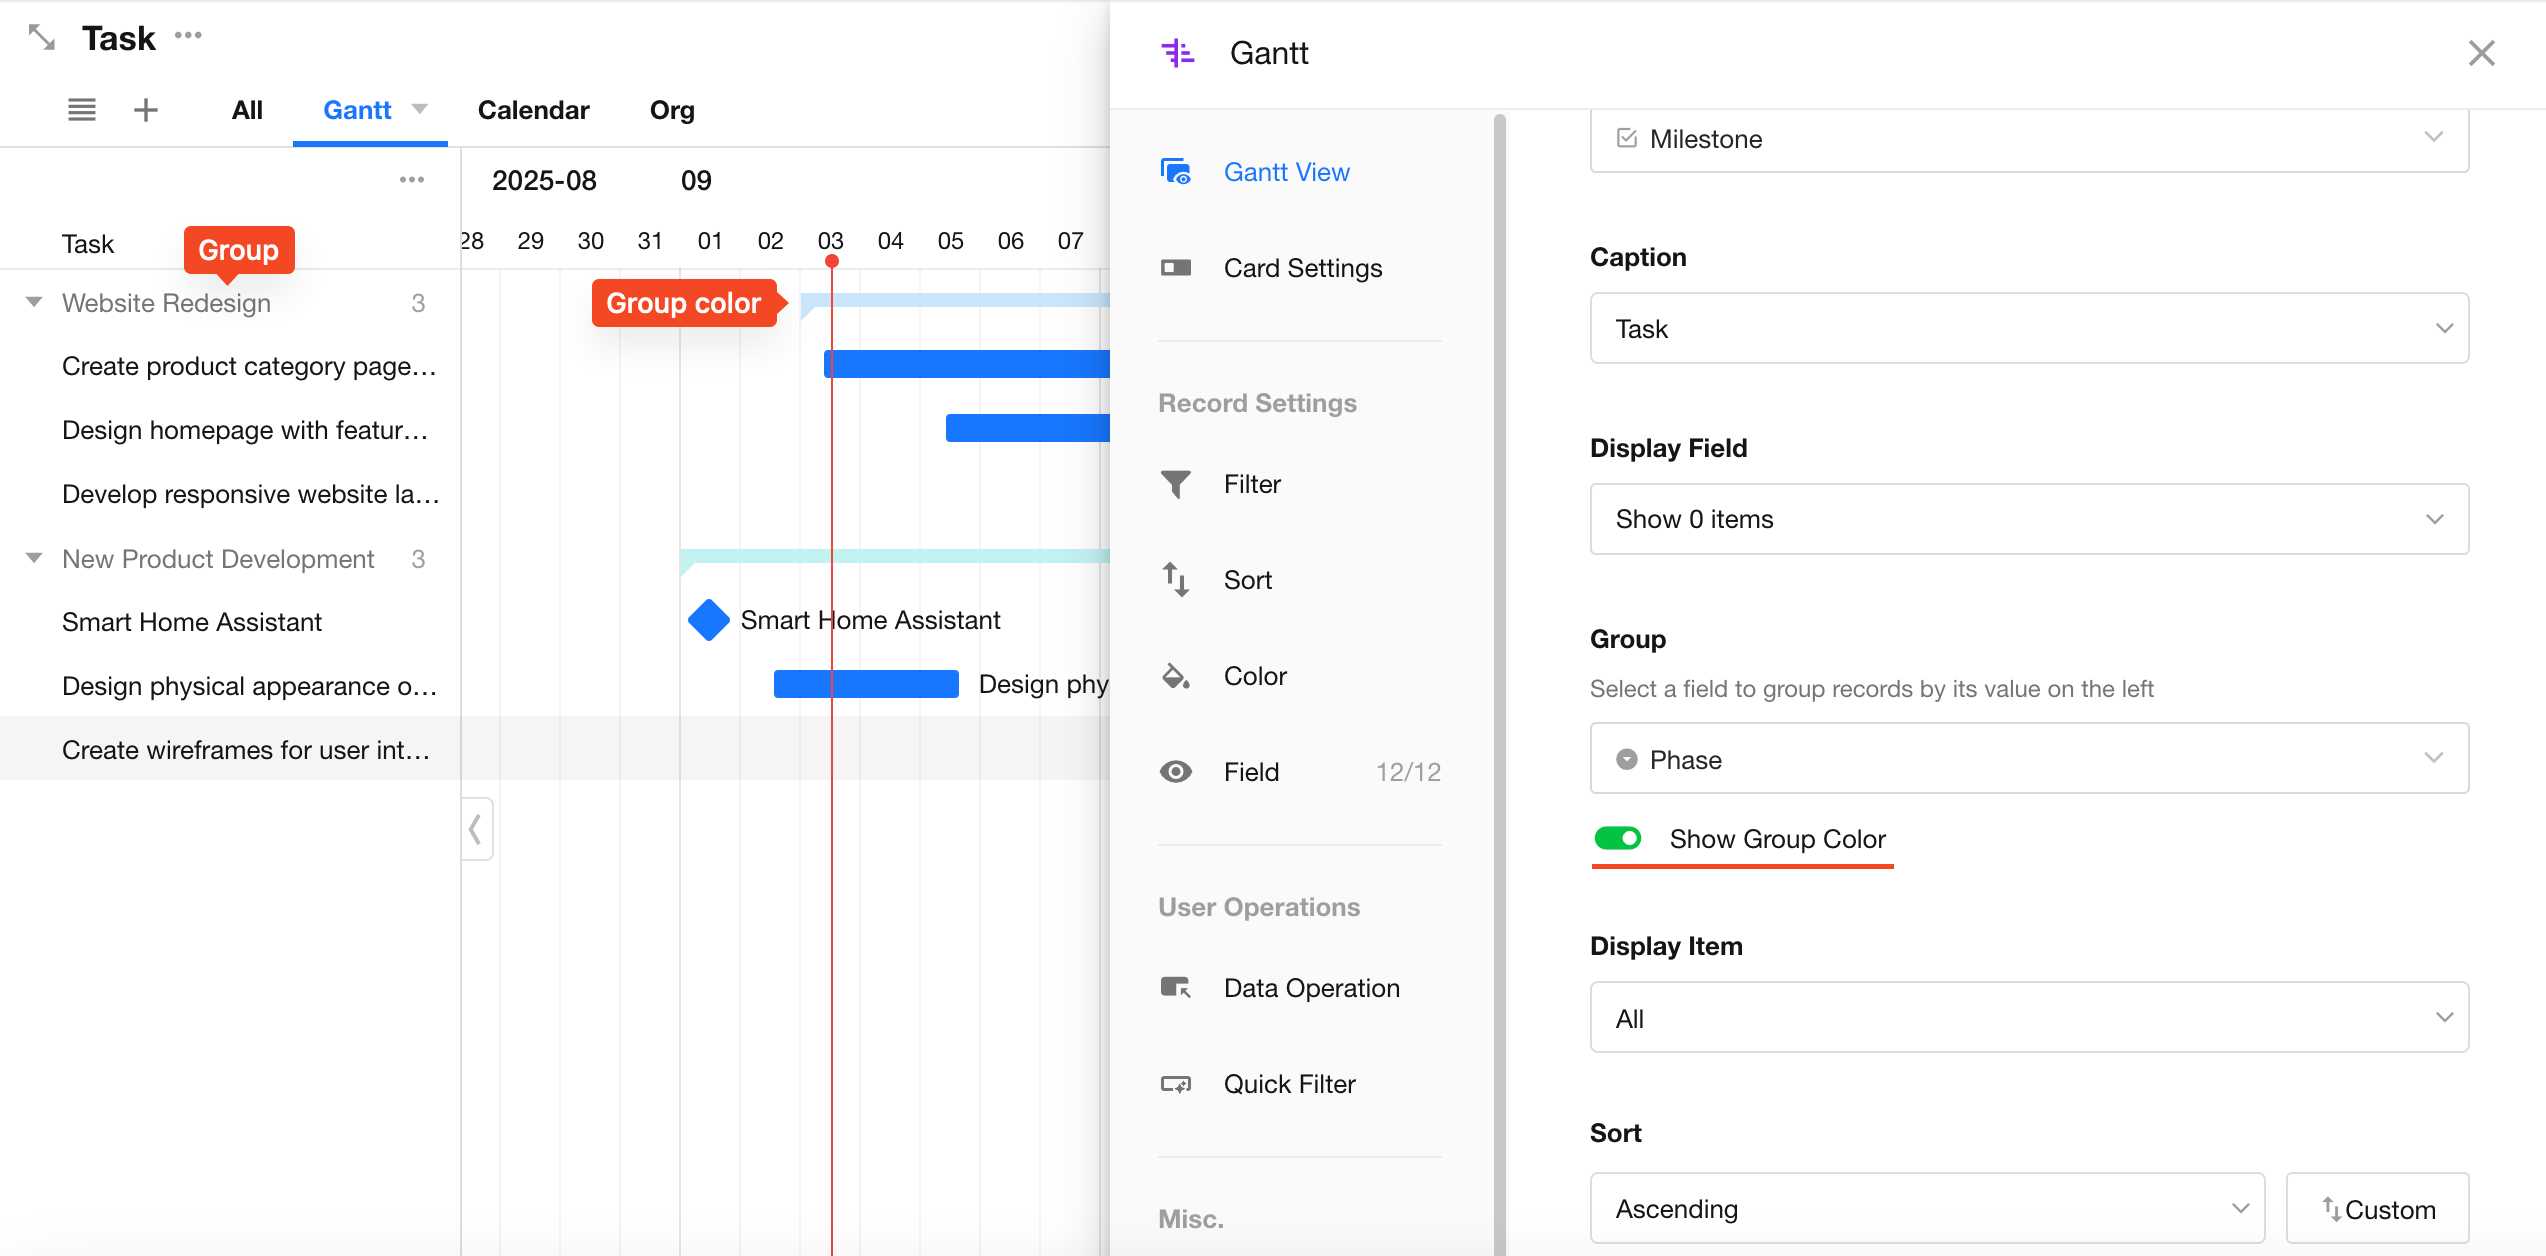
5. Grouping
Group records on the left by project, phase, or other fields. Supported fields include:
- Single Select
- Level
- Members
- Department
- Org-Roles
- Relationship (single record)
- Foreign field
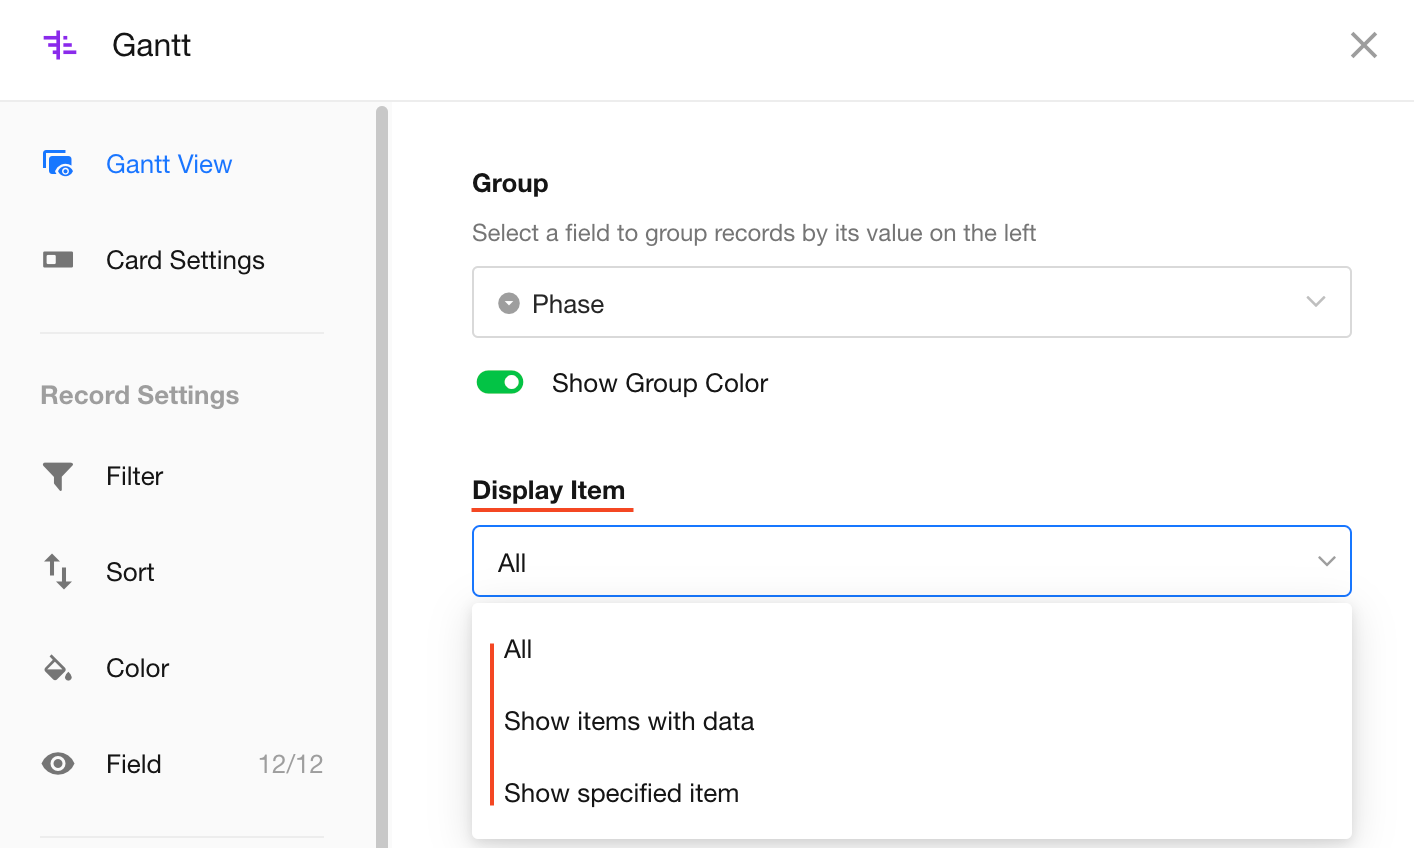
6. Display Items
You can choose to:
- Show all groups
- Only show groups with records
- Show specific groups
Groups without record data can be hidden unless selected otherwise.
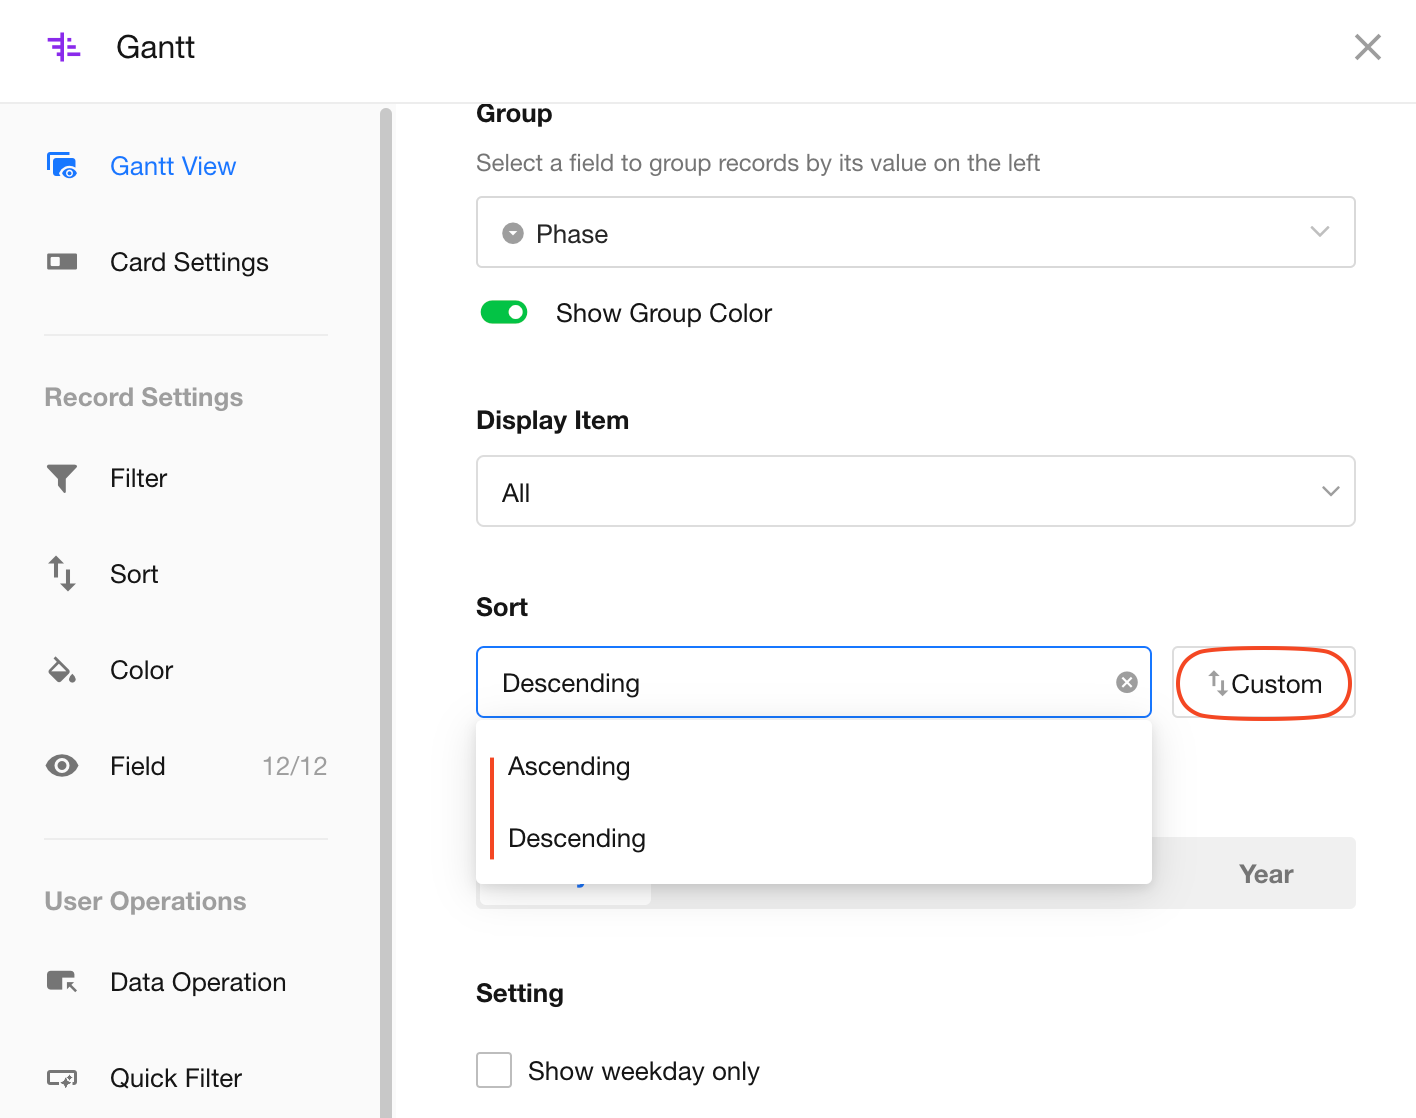
7. Group Sorting
Configure sorting rules for record groups.
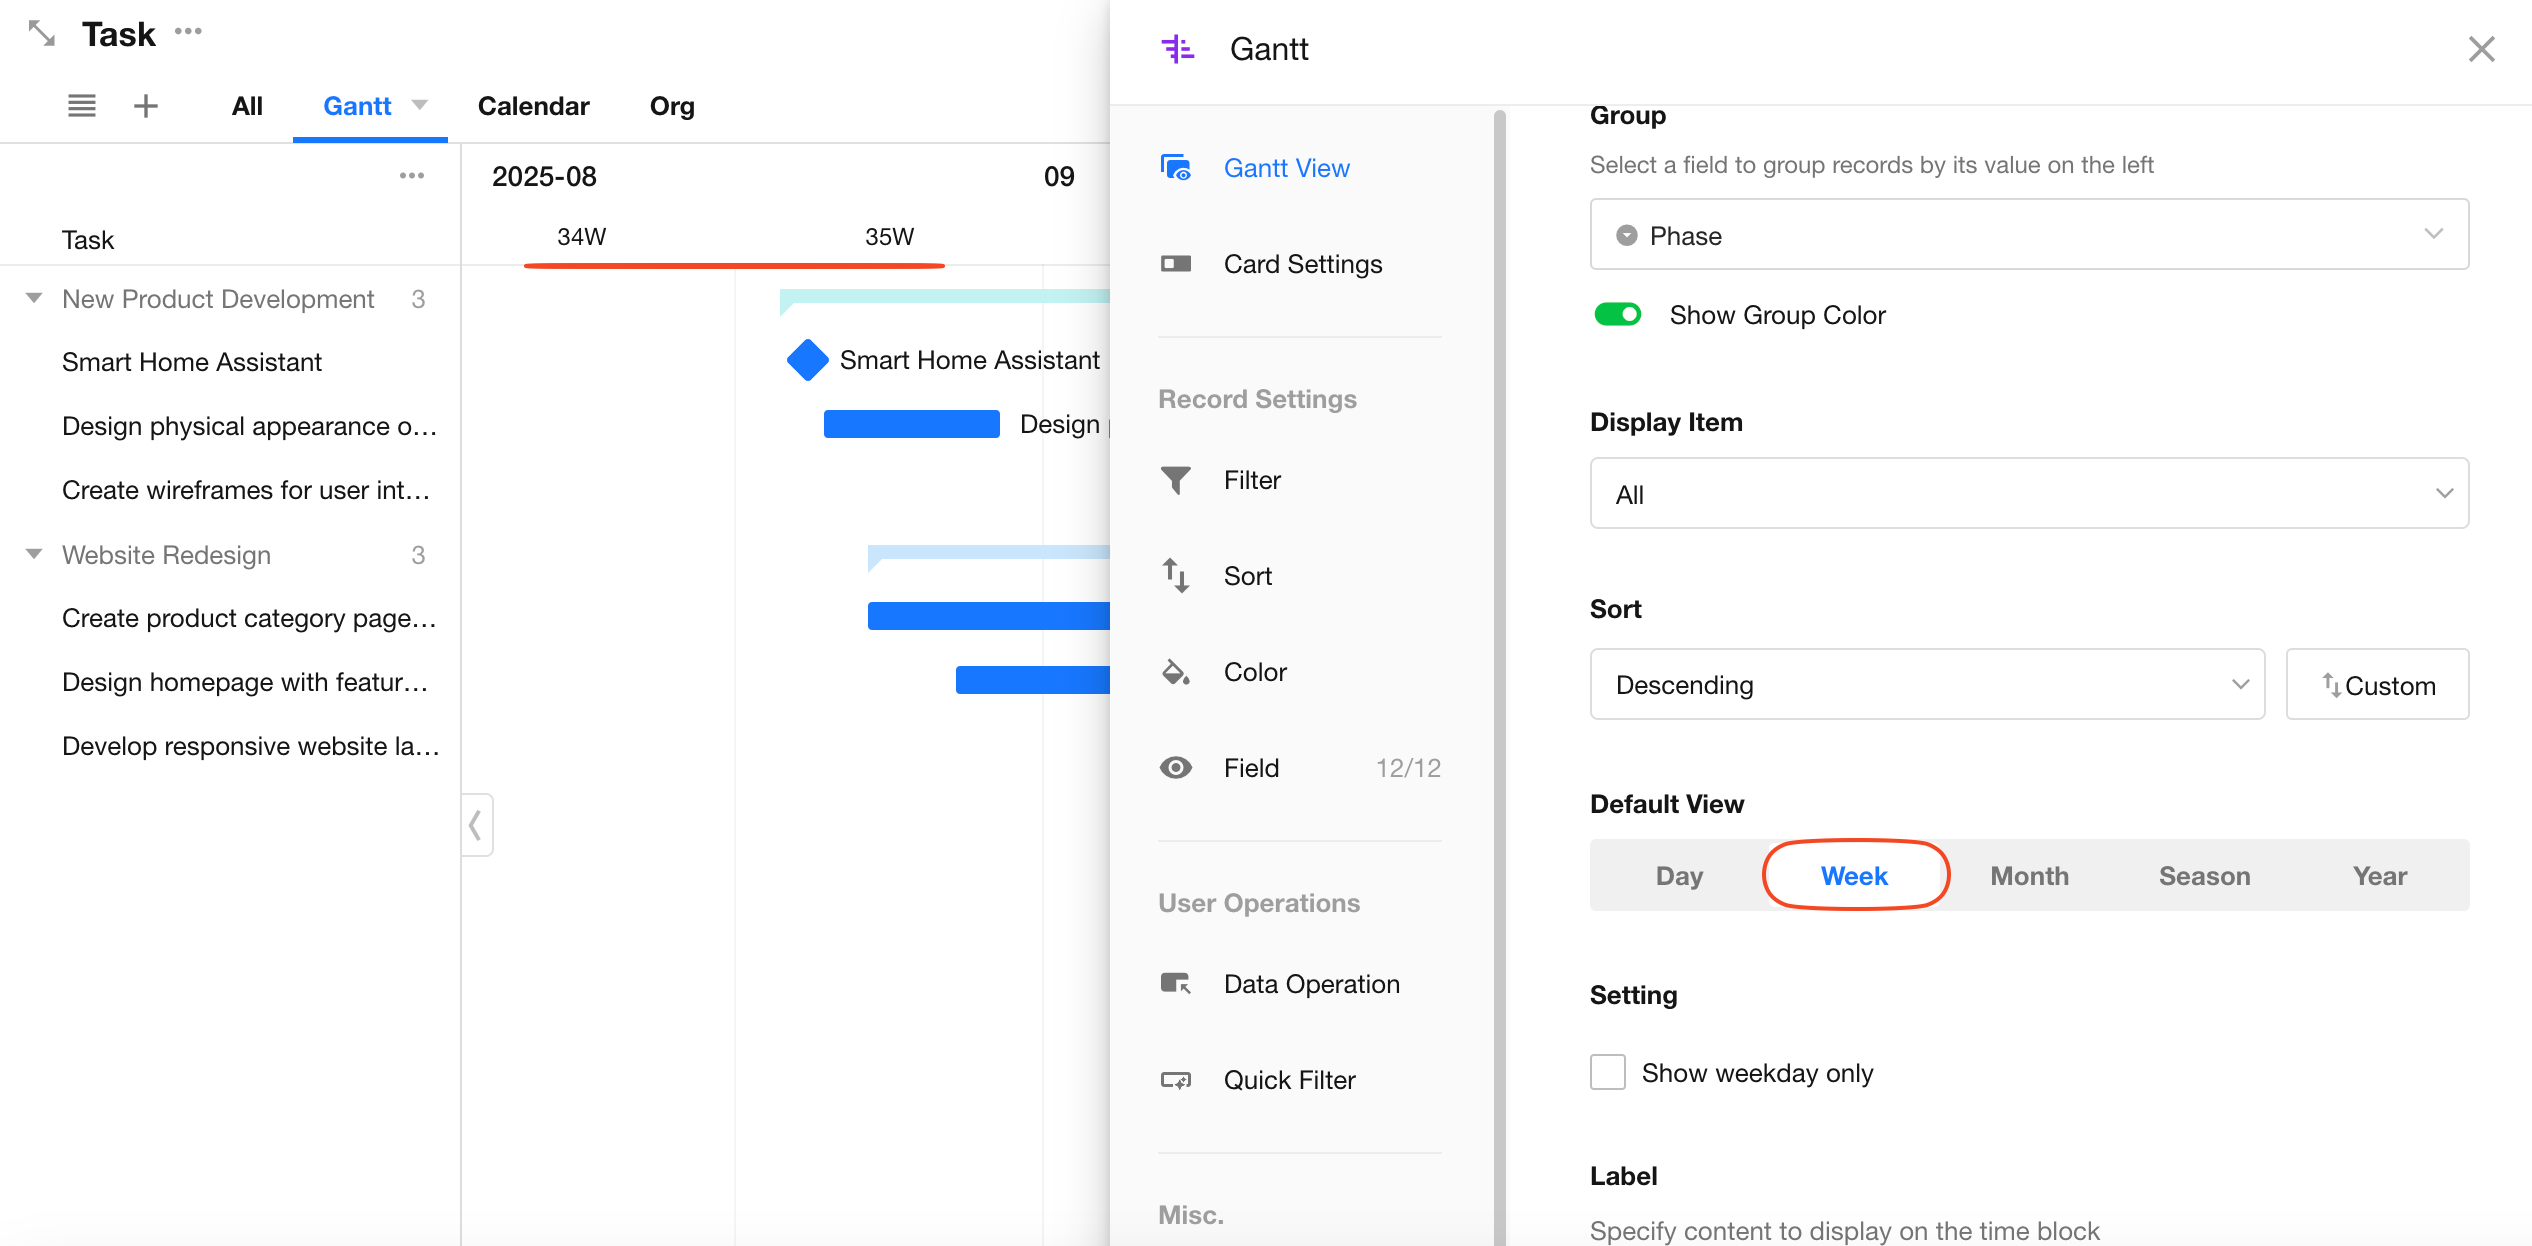
8. Default Timeline Precision
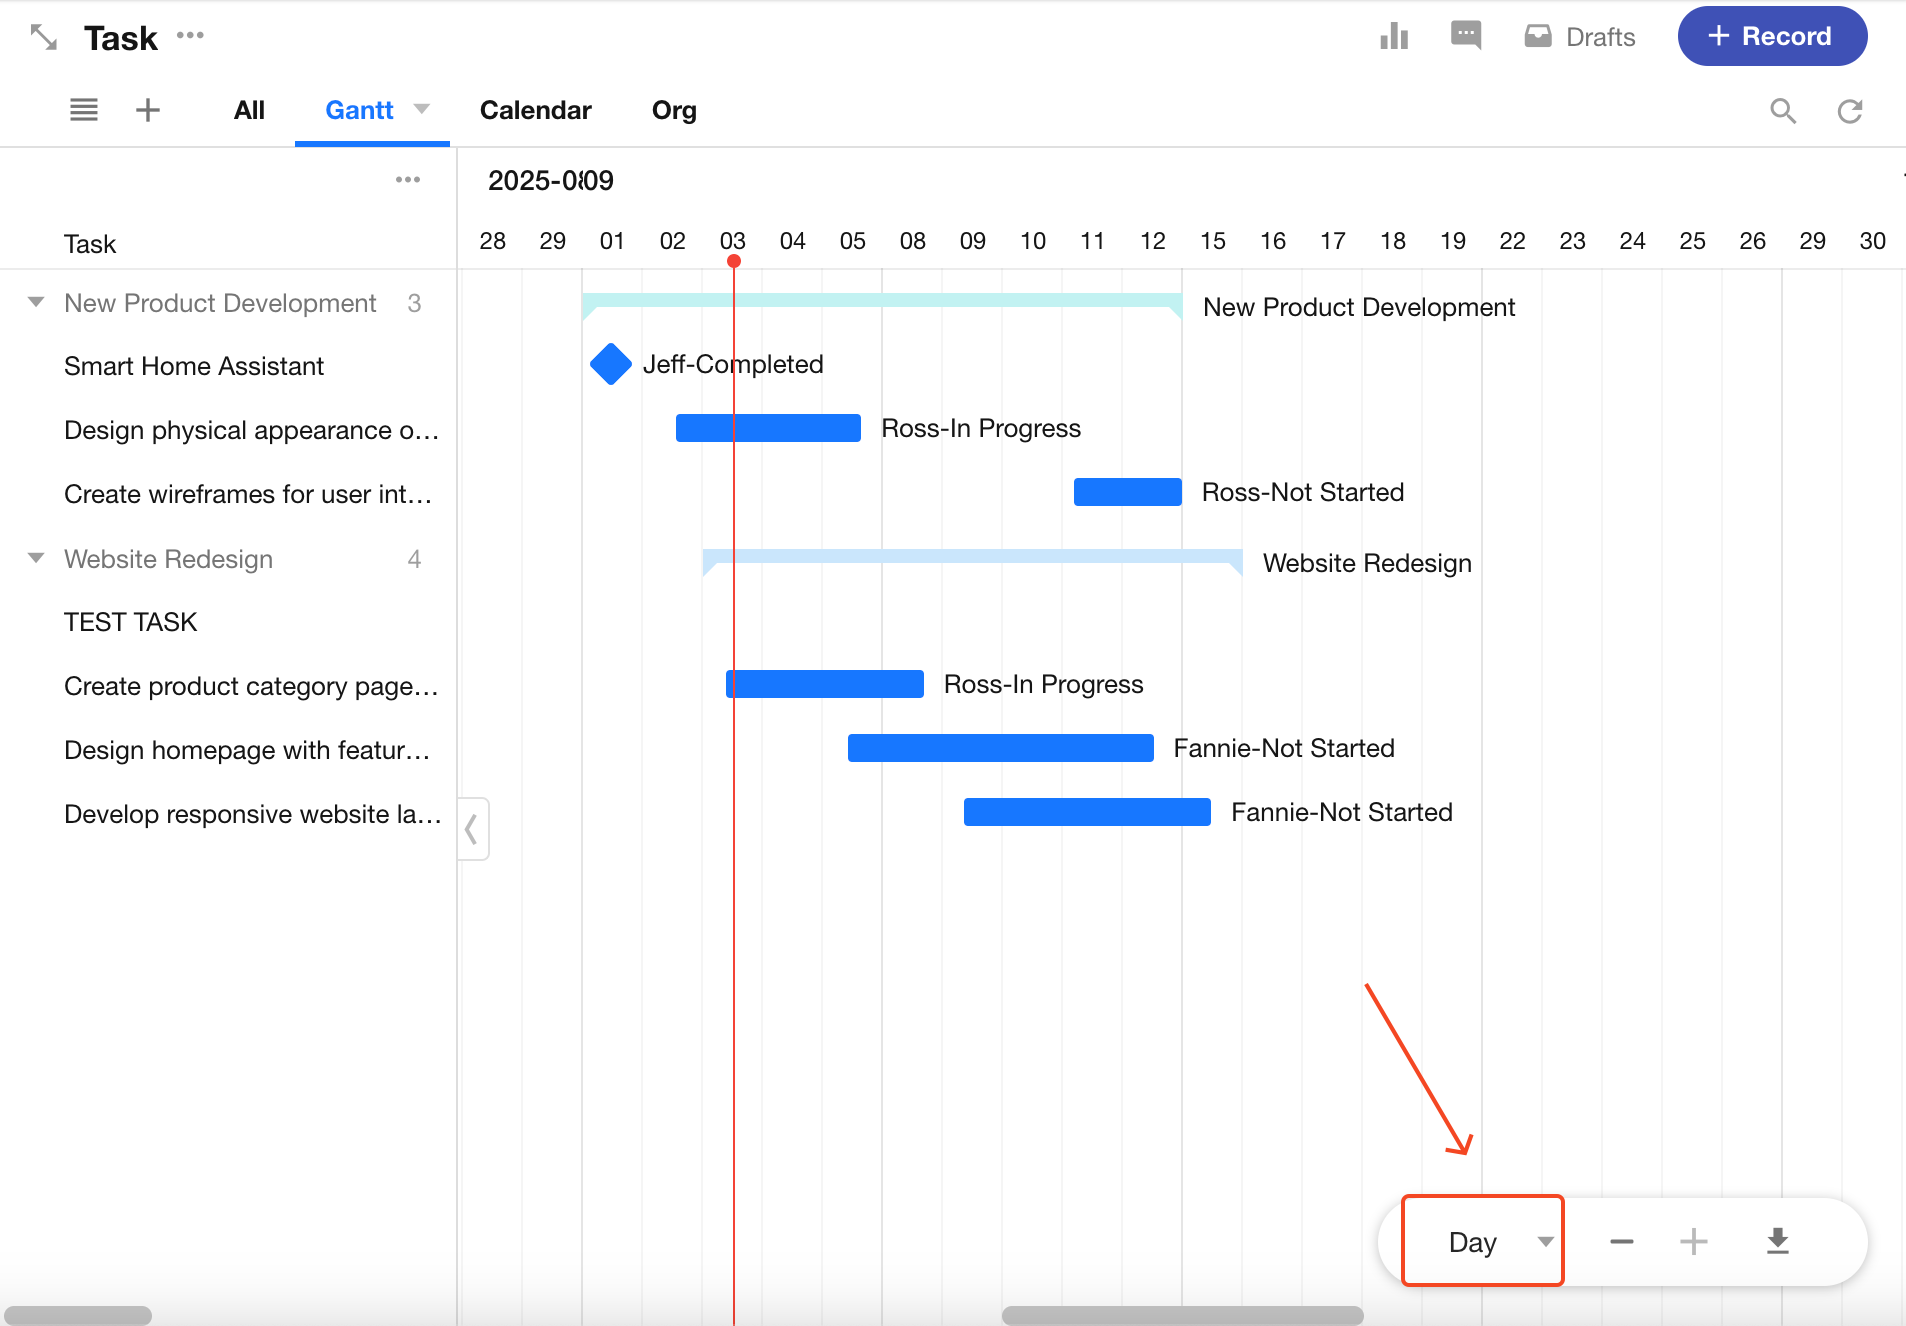
Set the default zoom level for the timeline—day, week, month, quarter, or year. Users can later adjust manually.
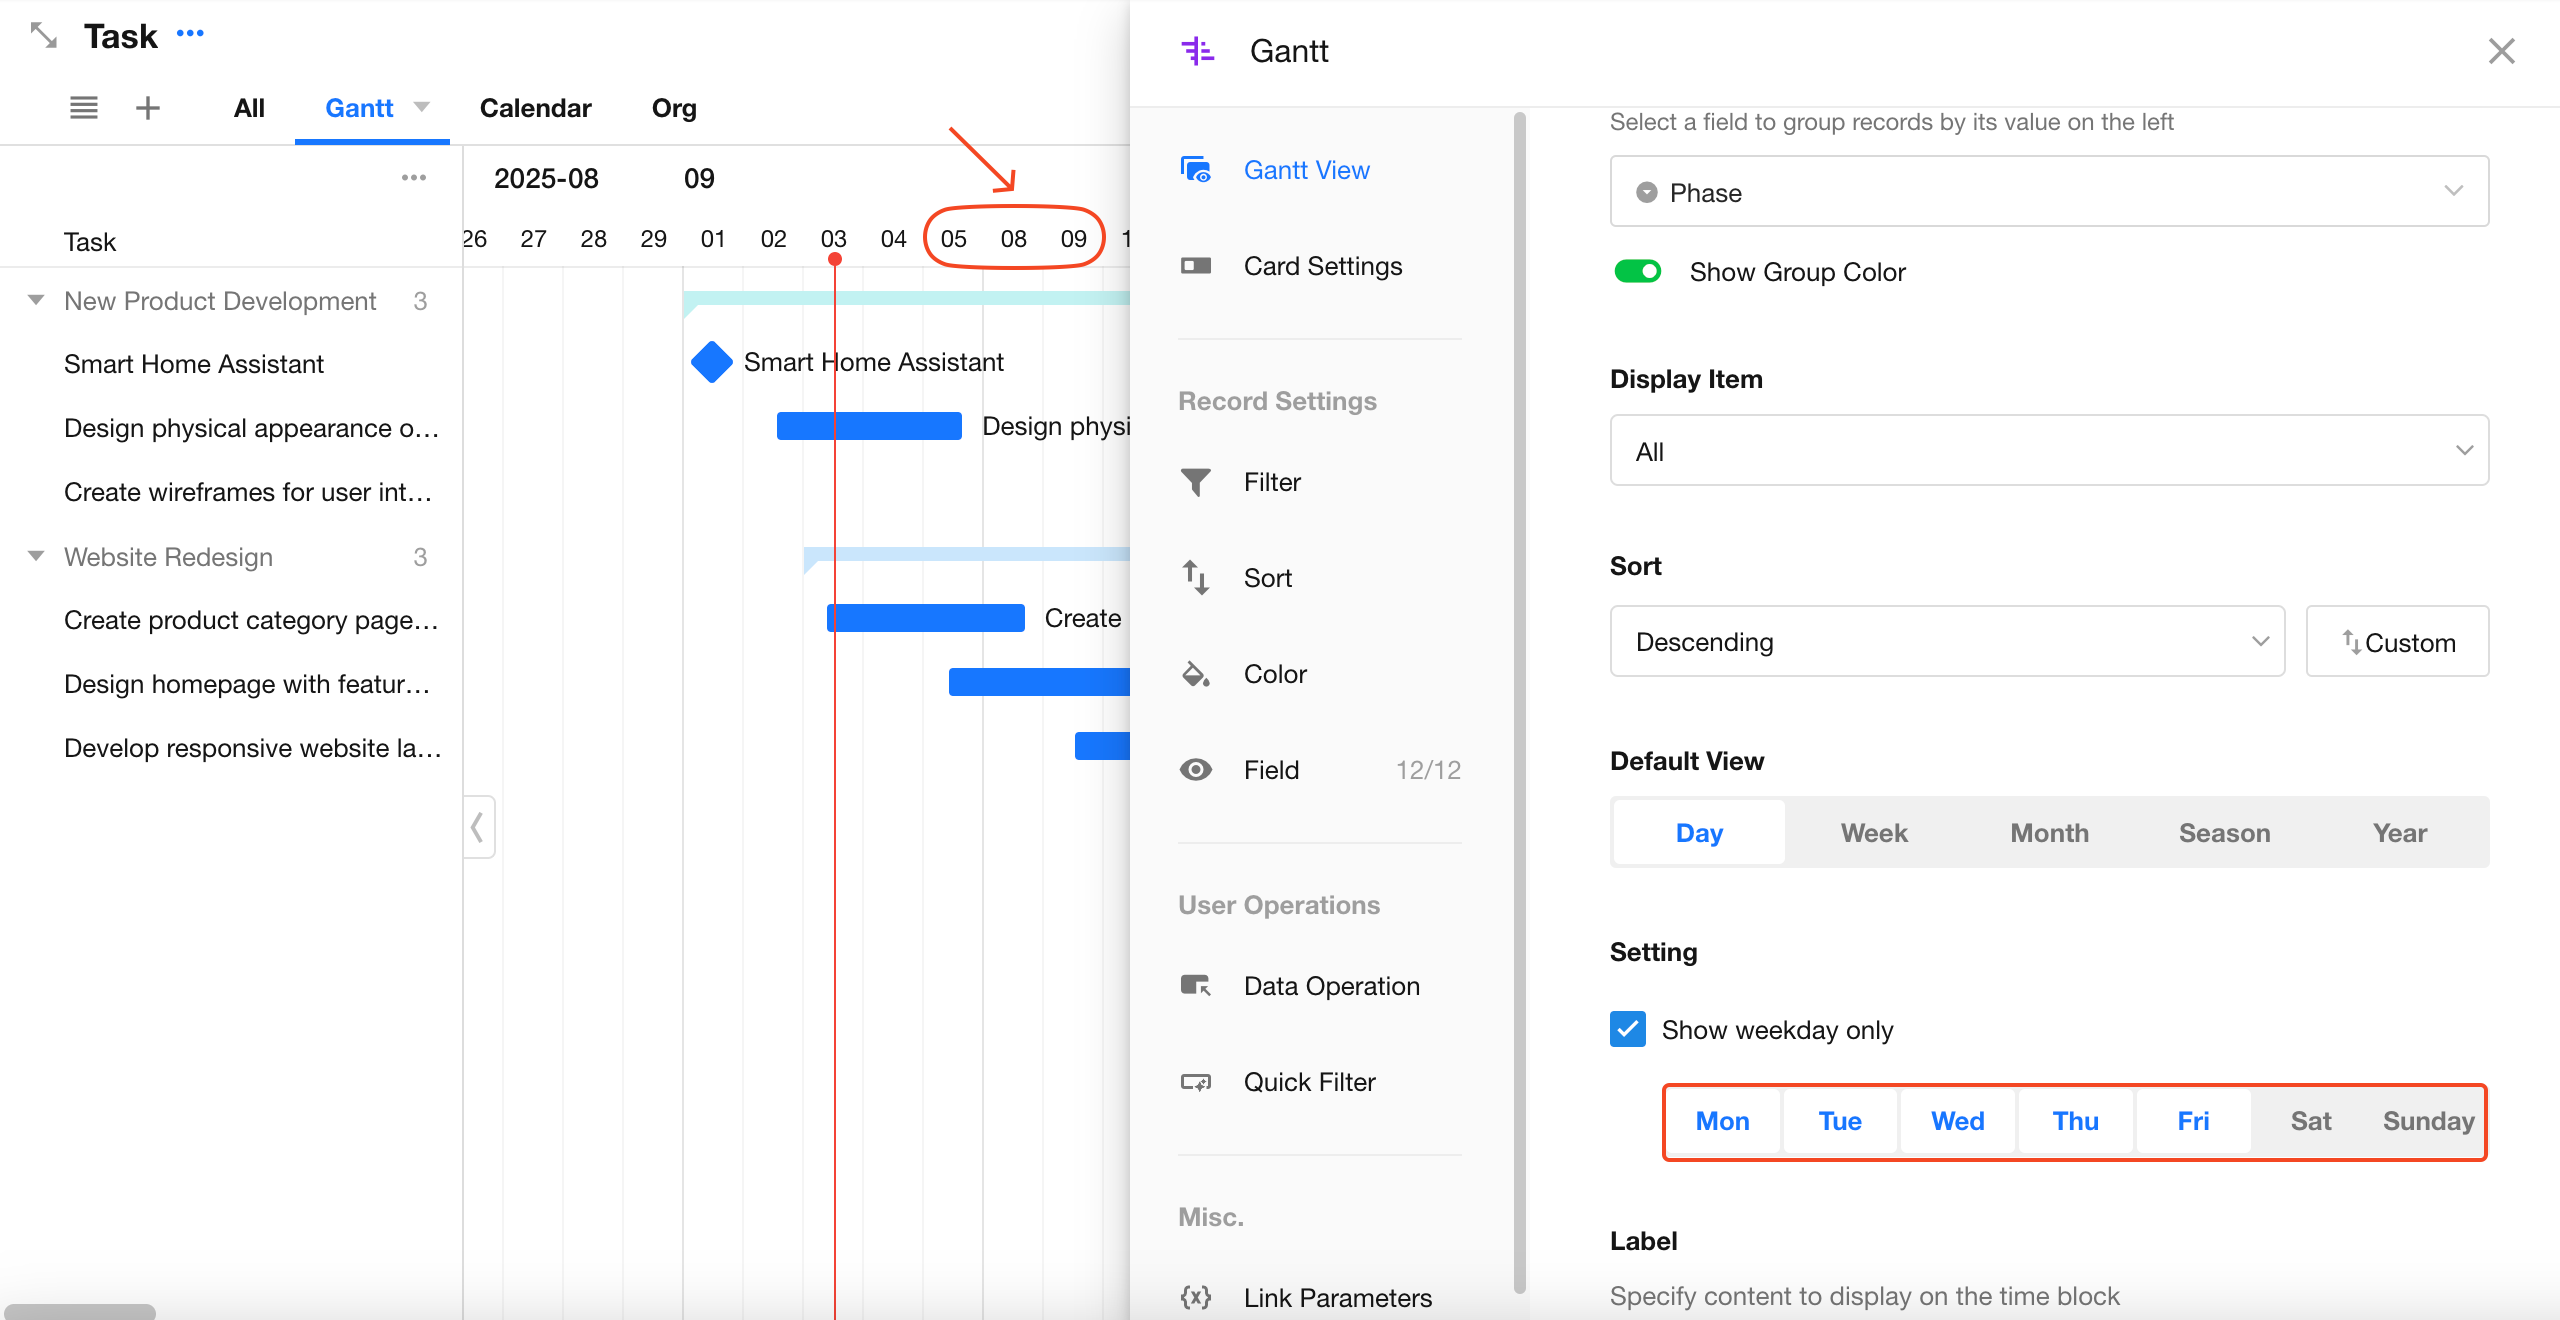
9. Show Weekday Only
Choose whether to hide days in the timeline.
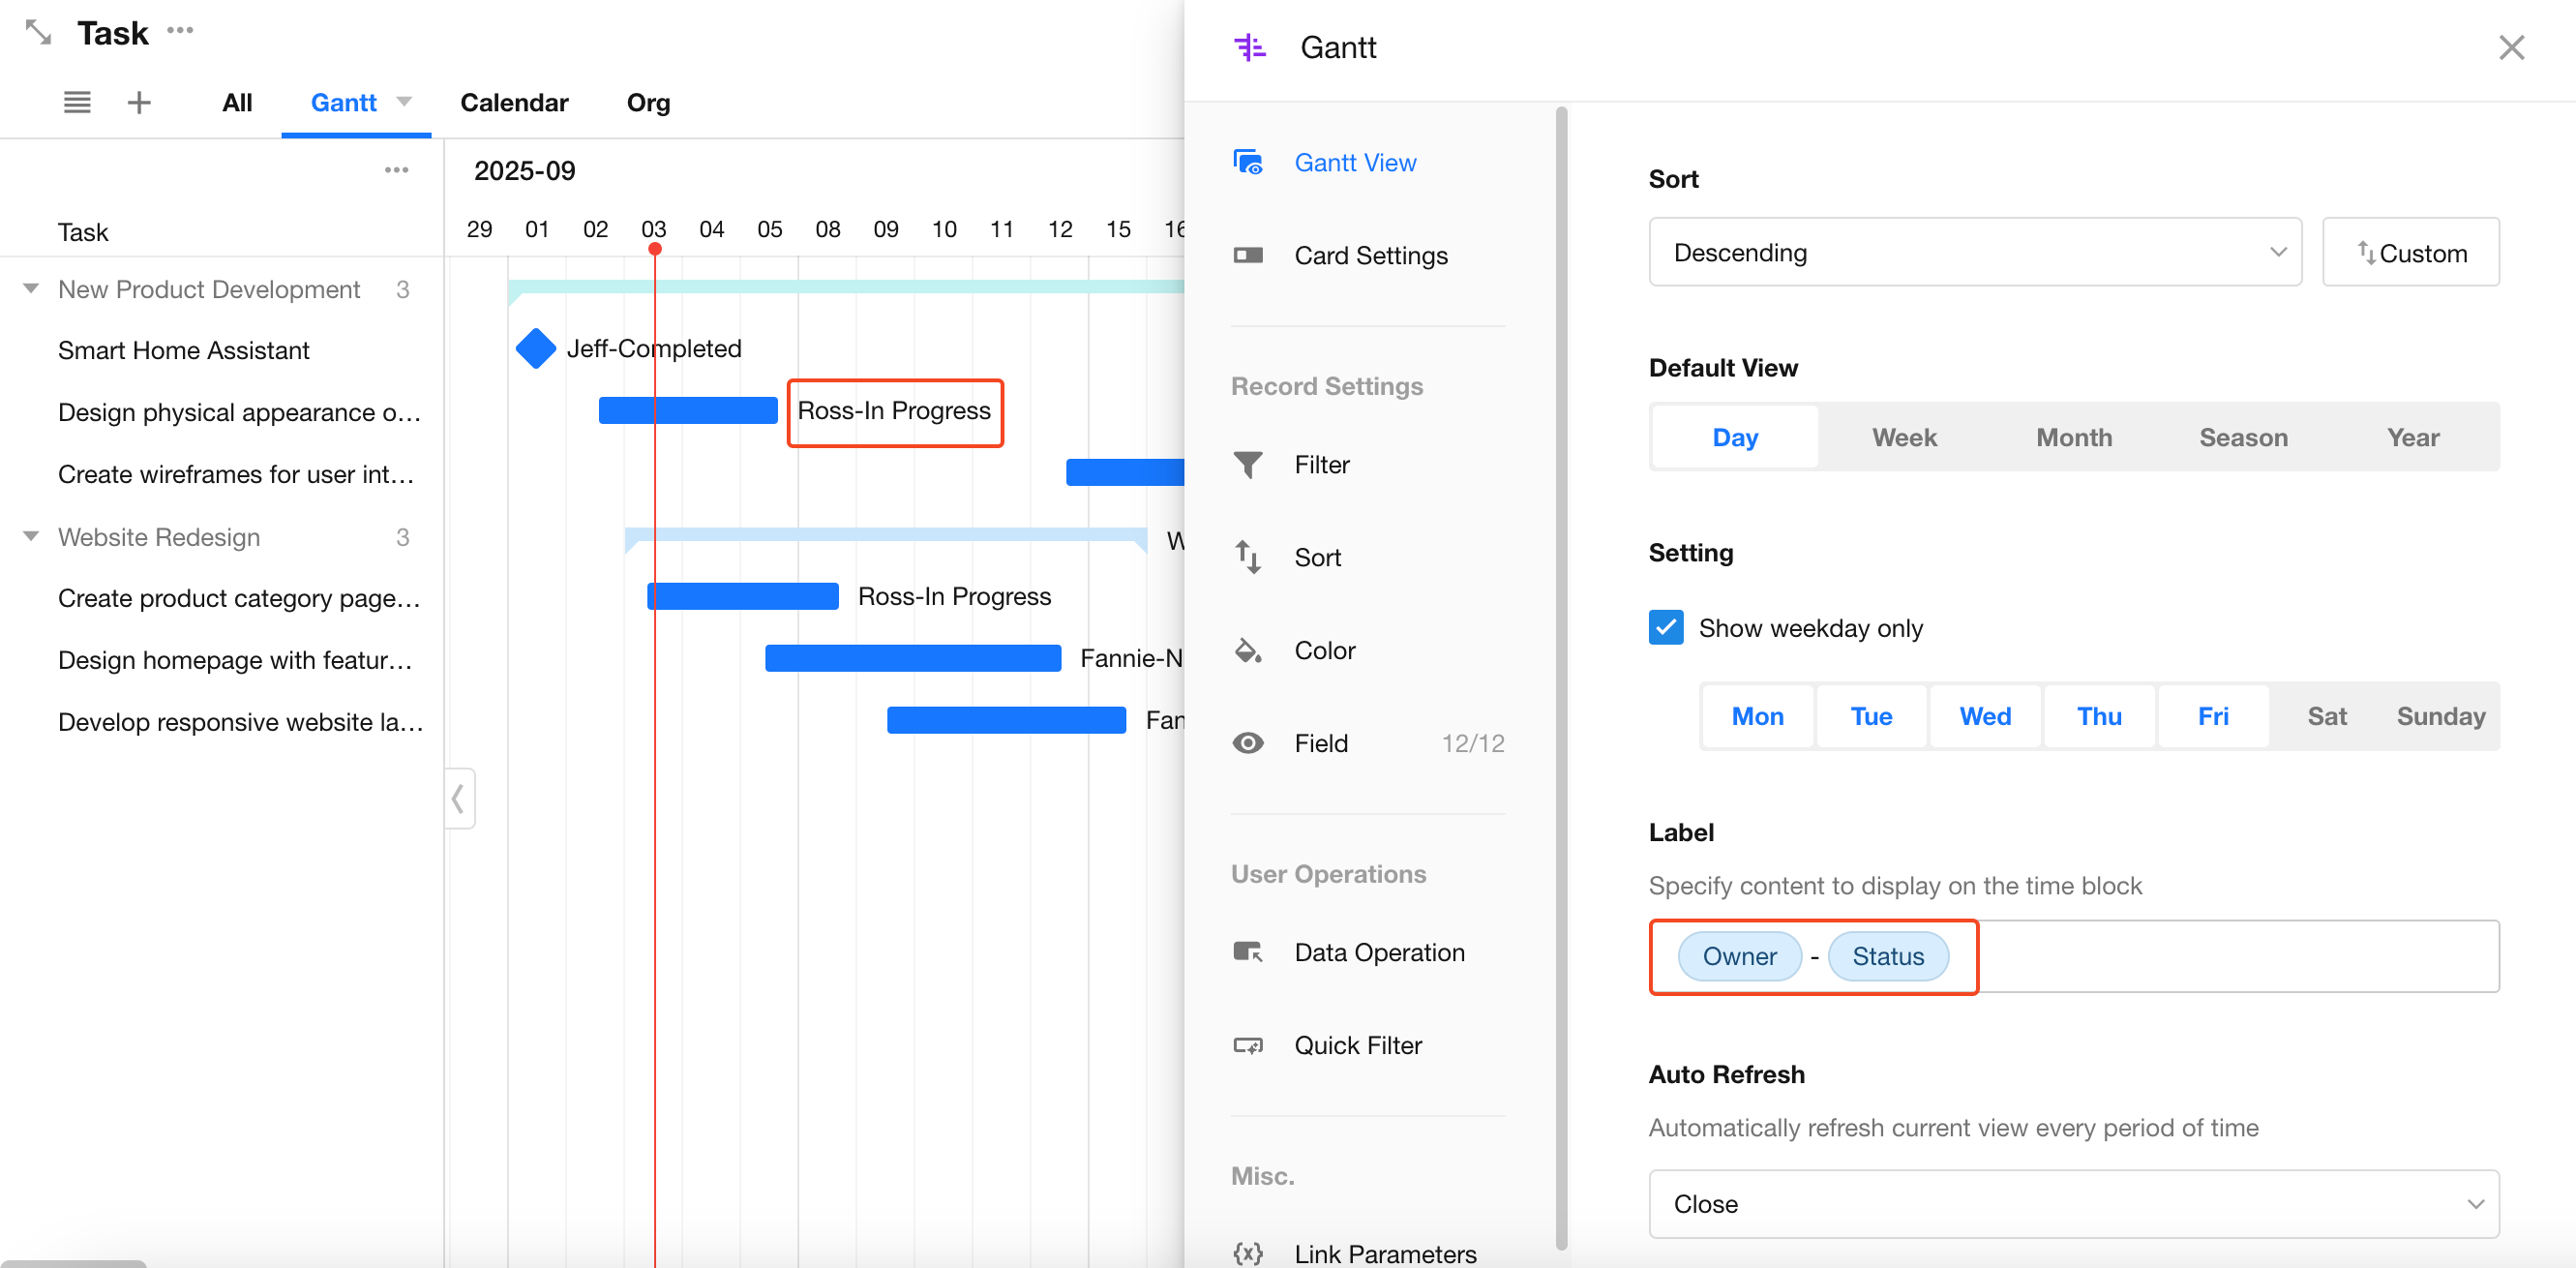
10. Label
You can display one or more fields next to each task bar.
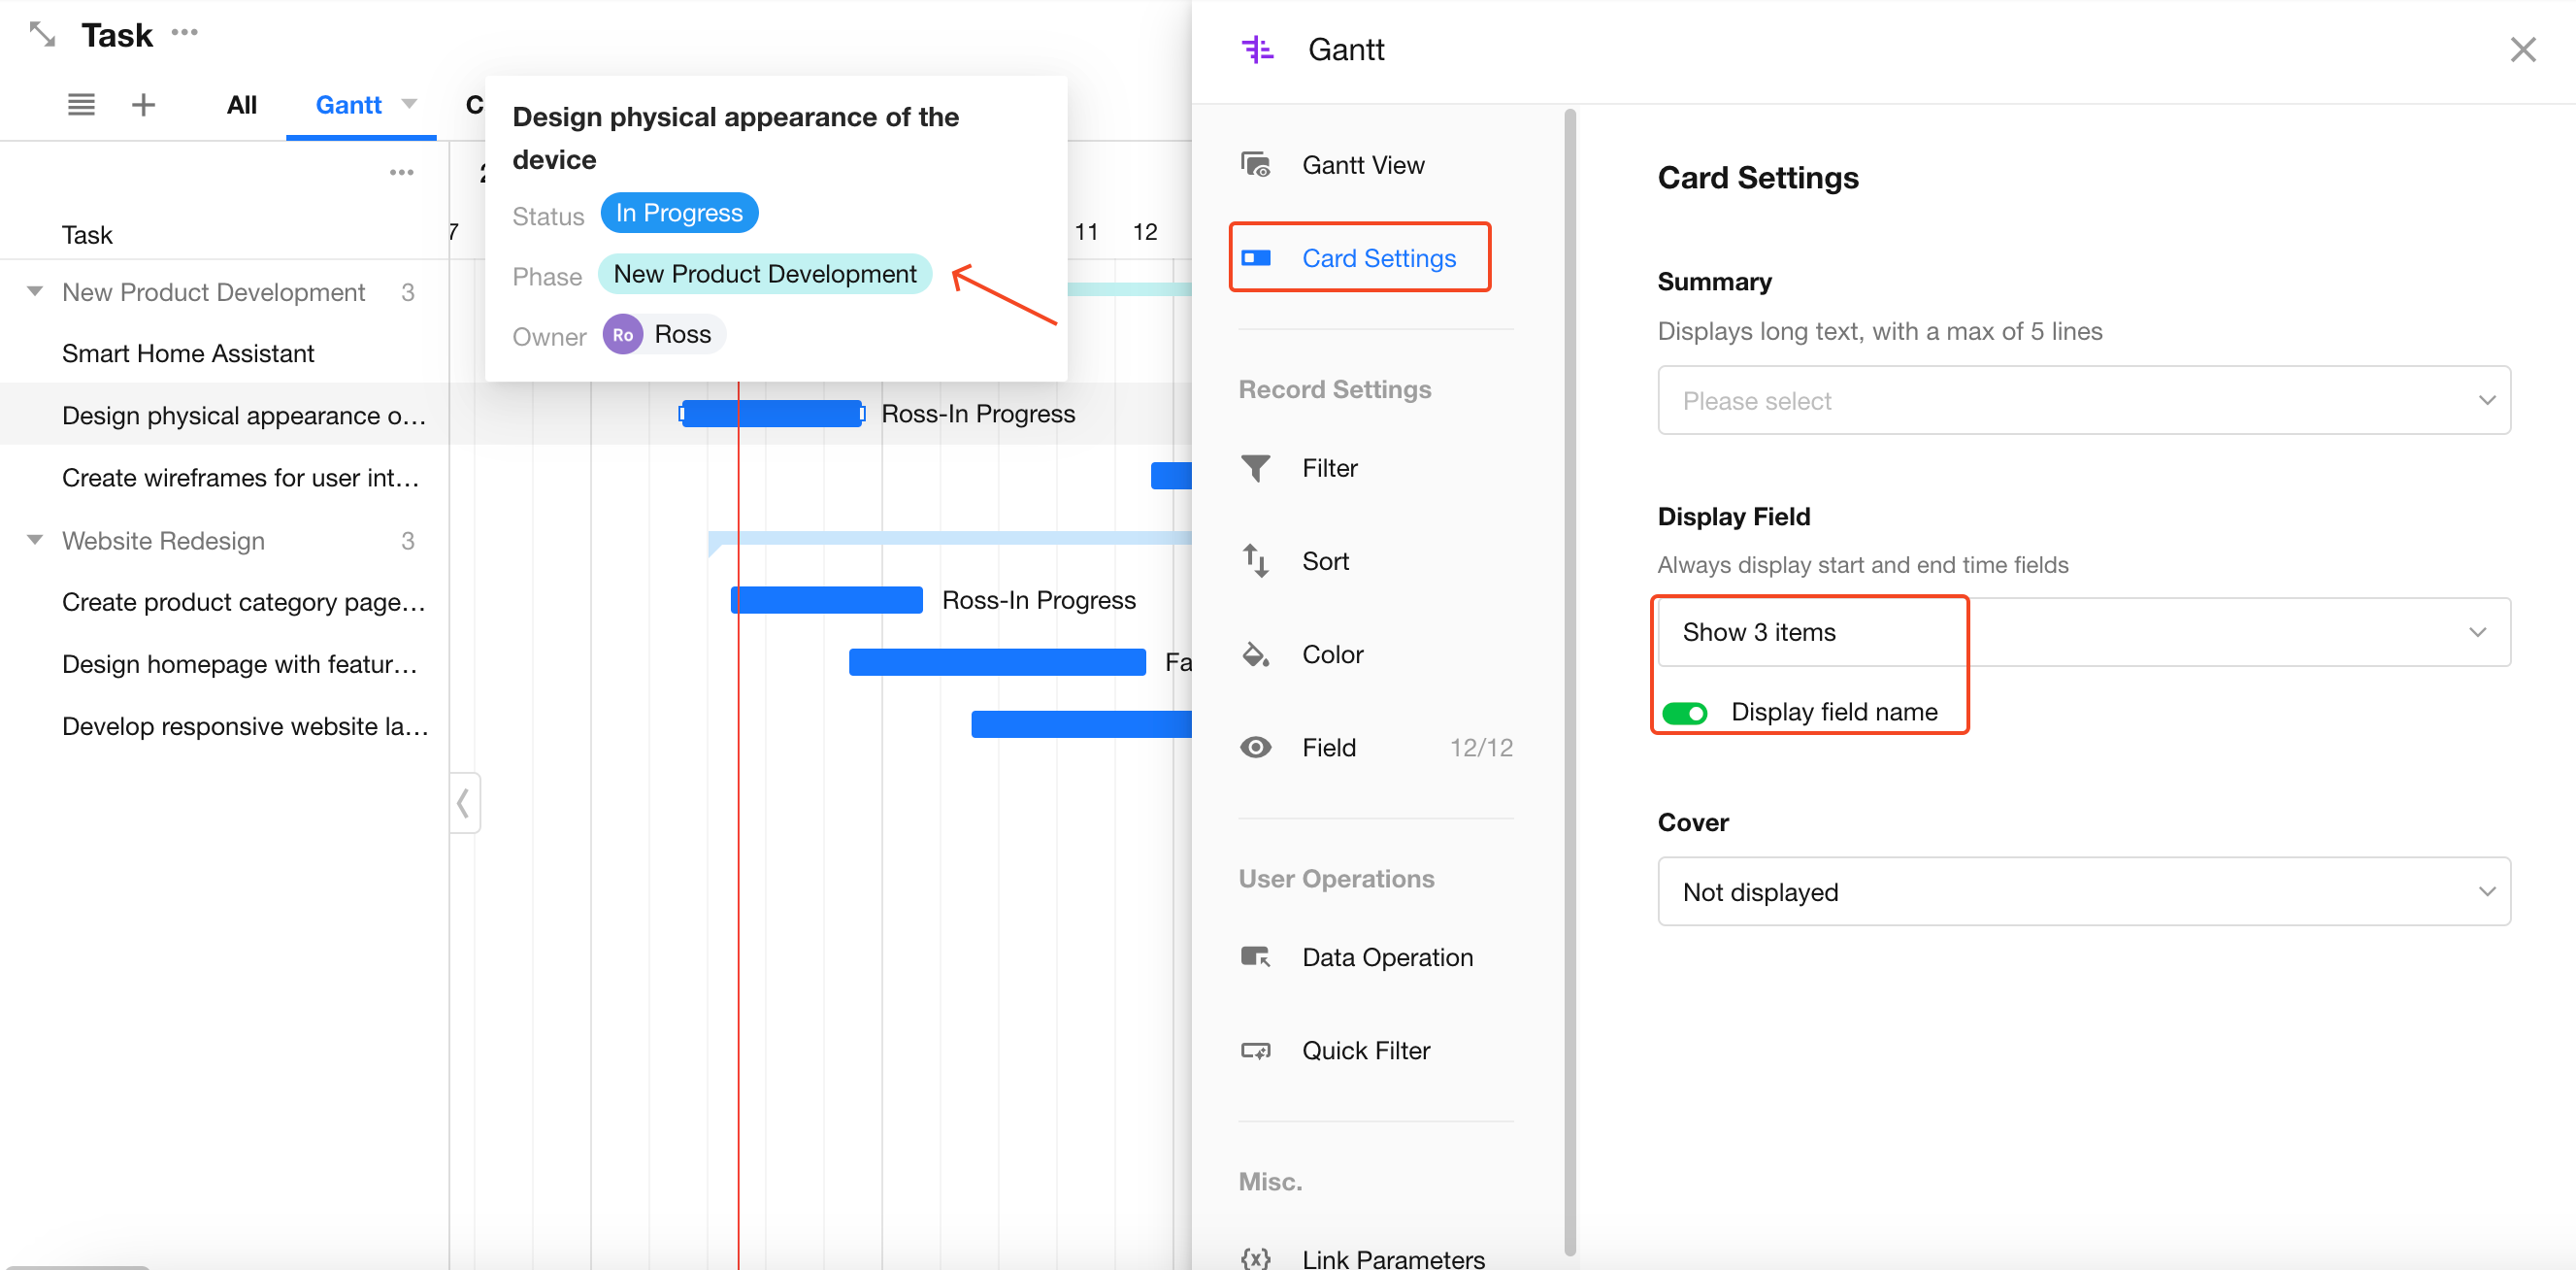
11. Card Settings
Hovering over a task bar shows a record card with fields and optional cover image.
User Actions
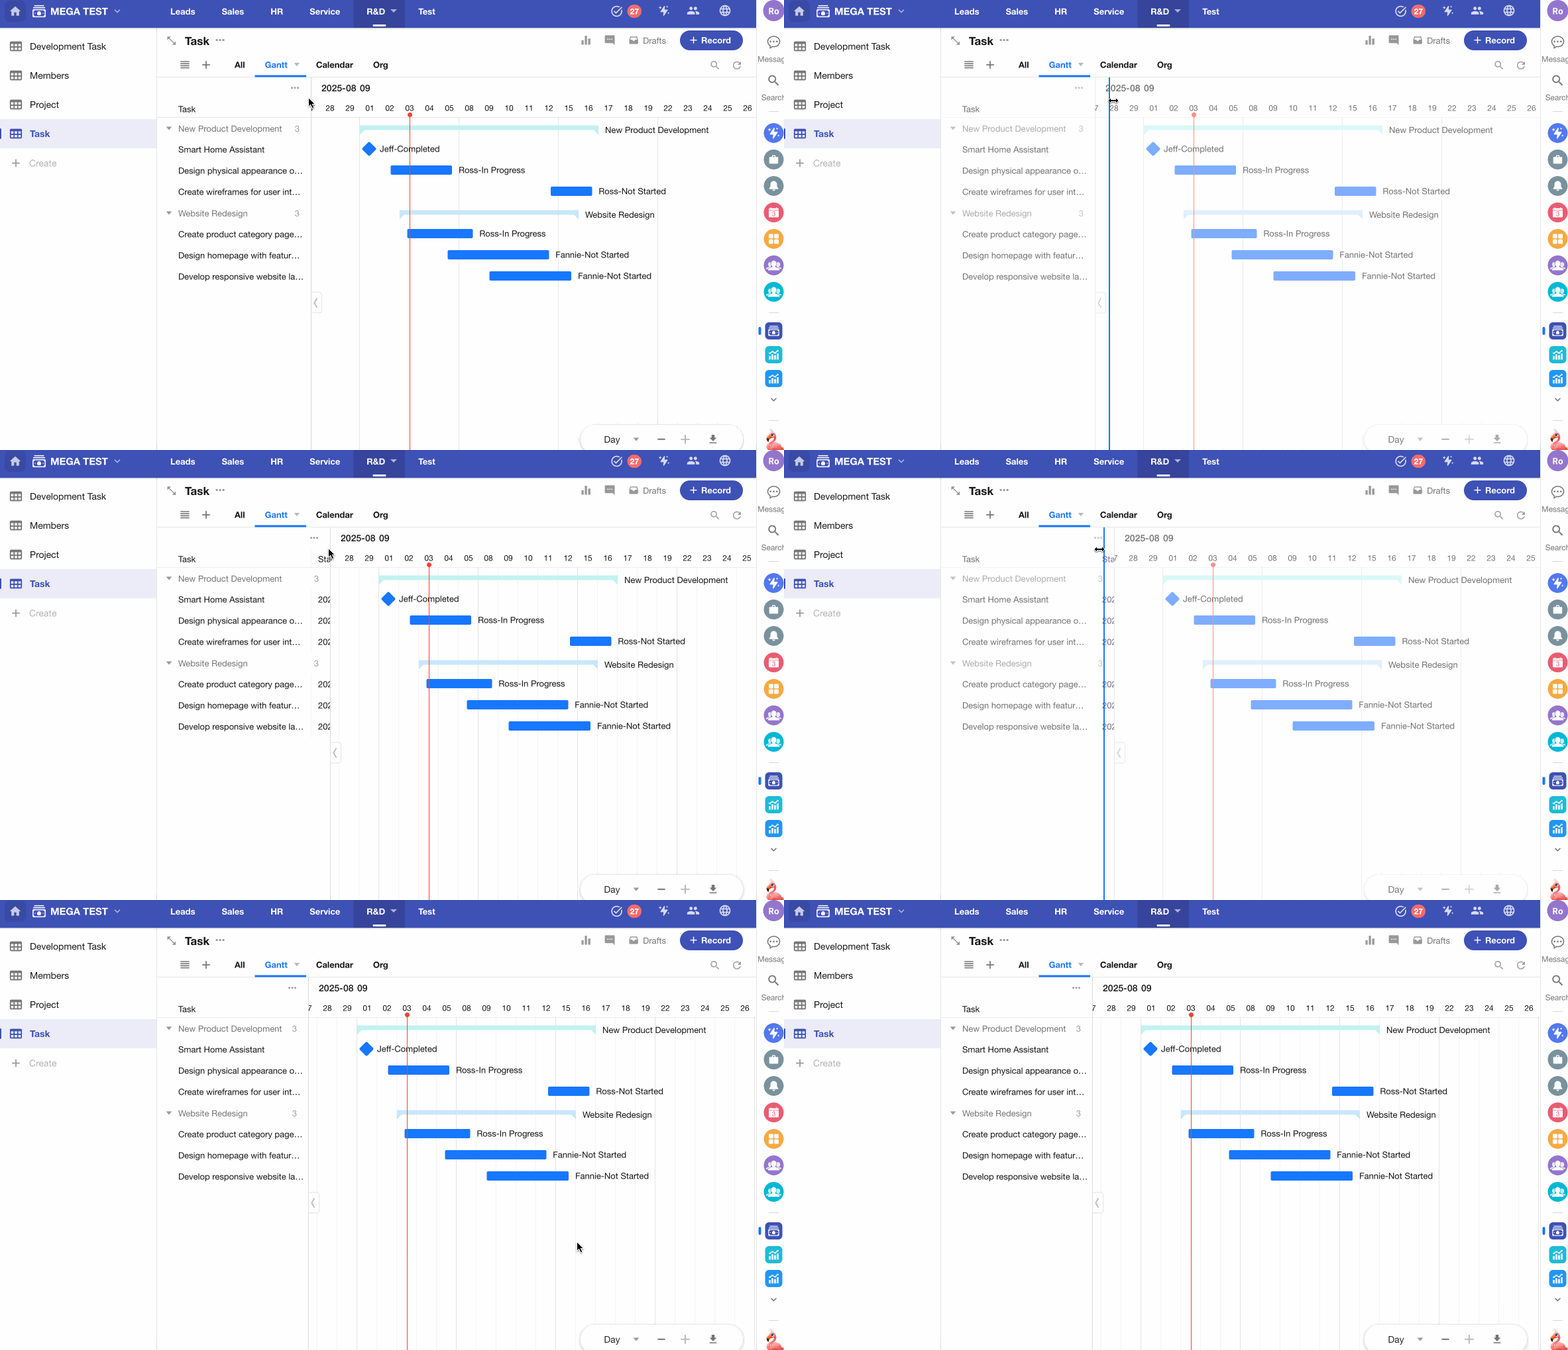
1. Resize Left Panel
Drag the divider between the record list and the chart to adjust the width.
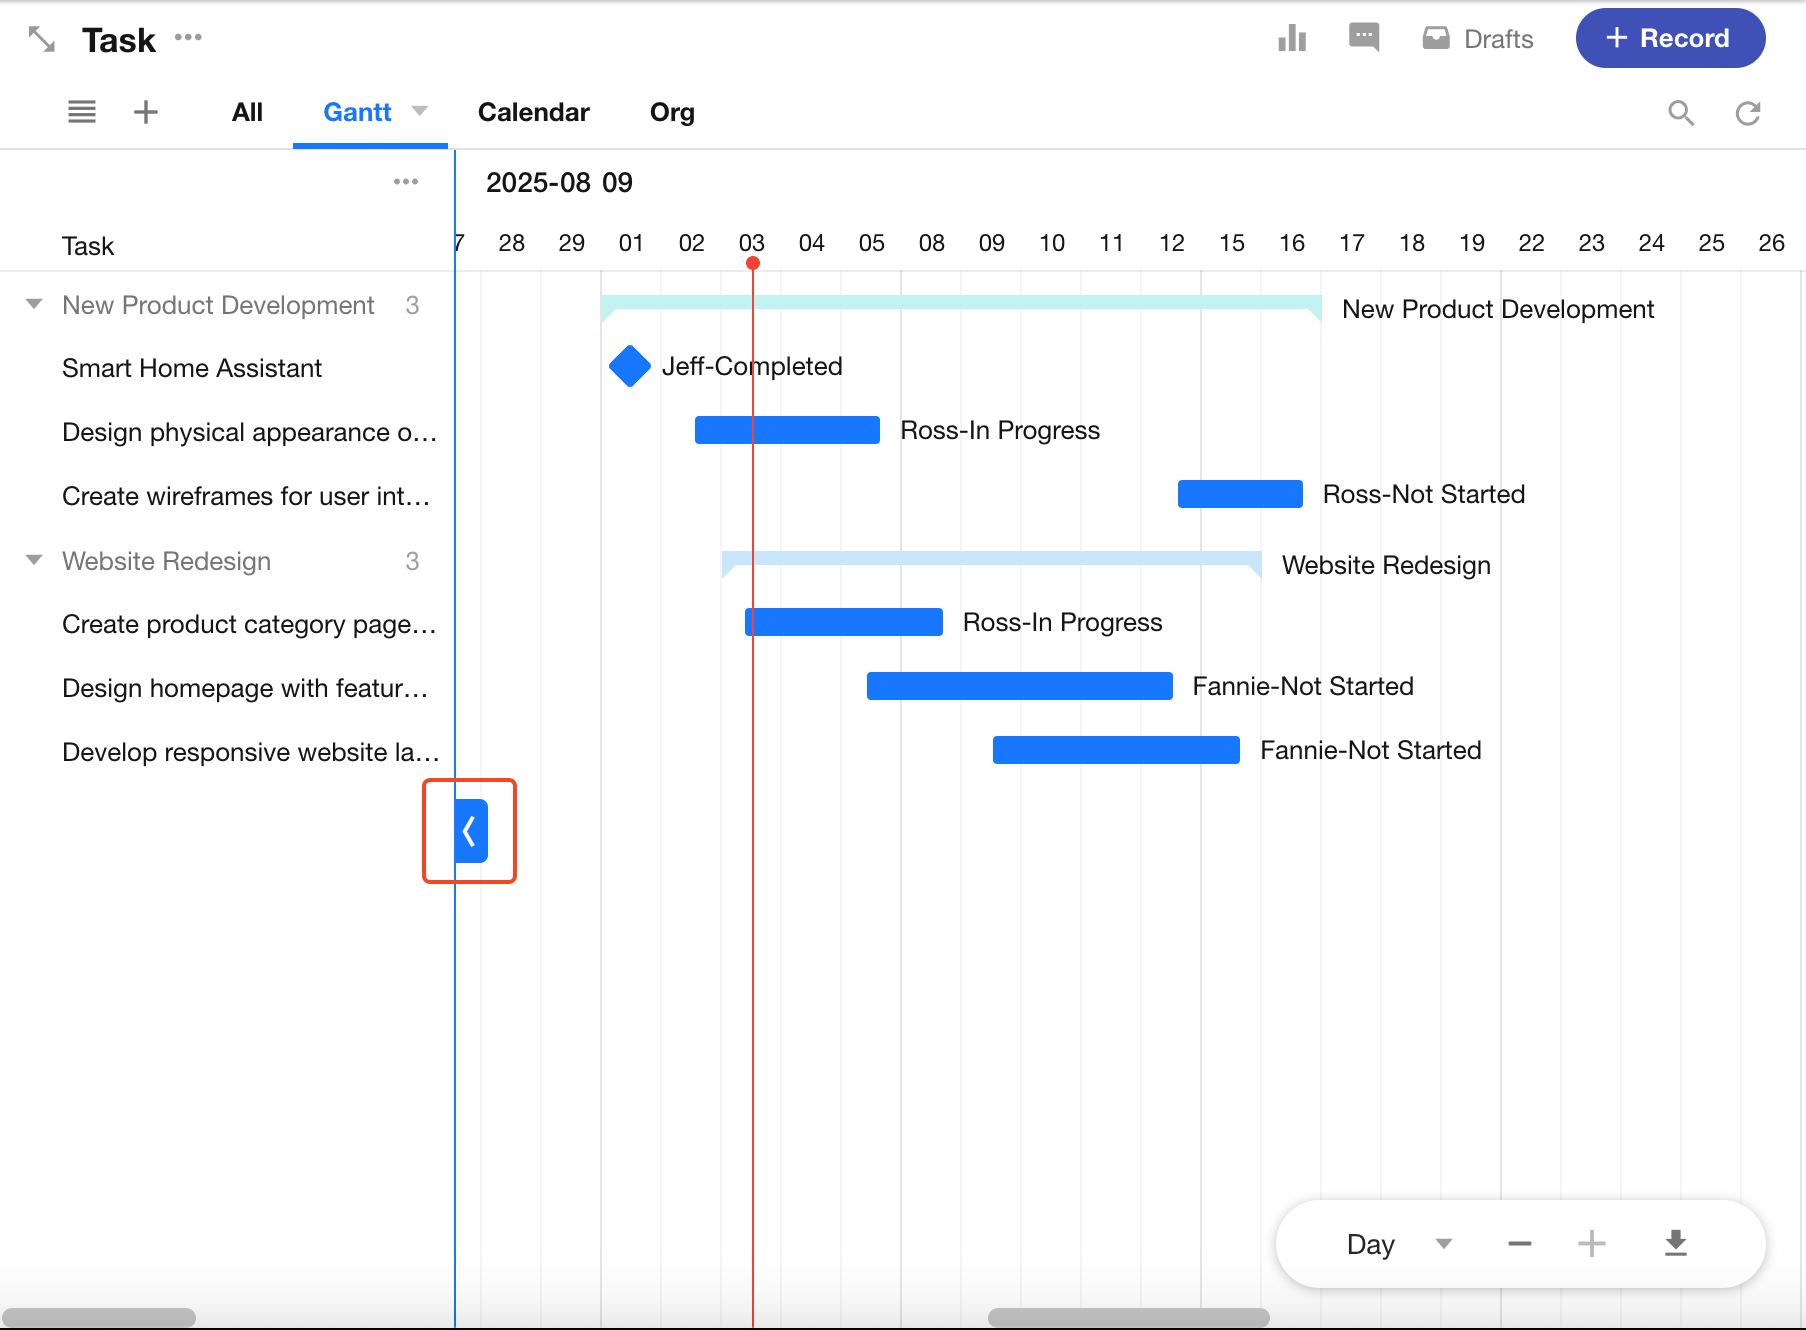
2. Collapse/Expand Record List
Click the “<” or “>” buttons to collapse or expand the record list.
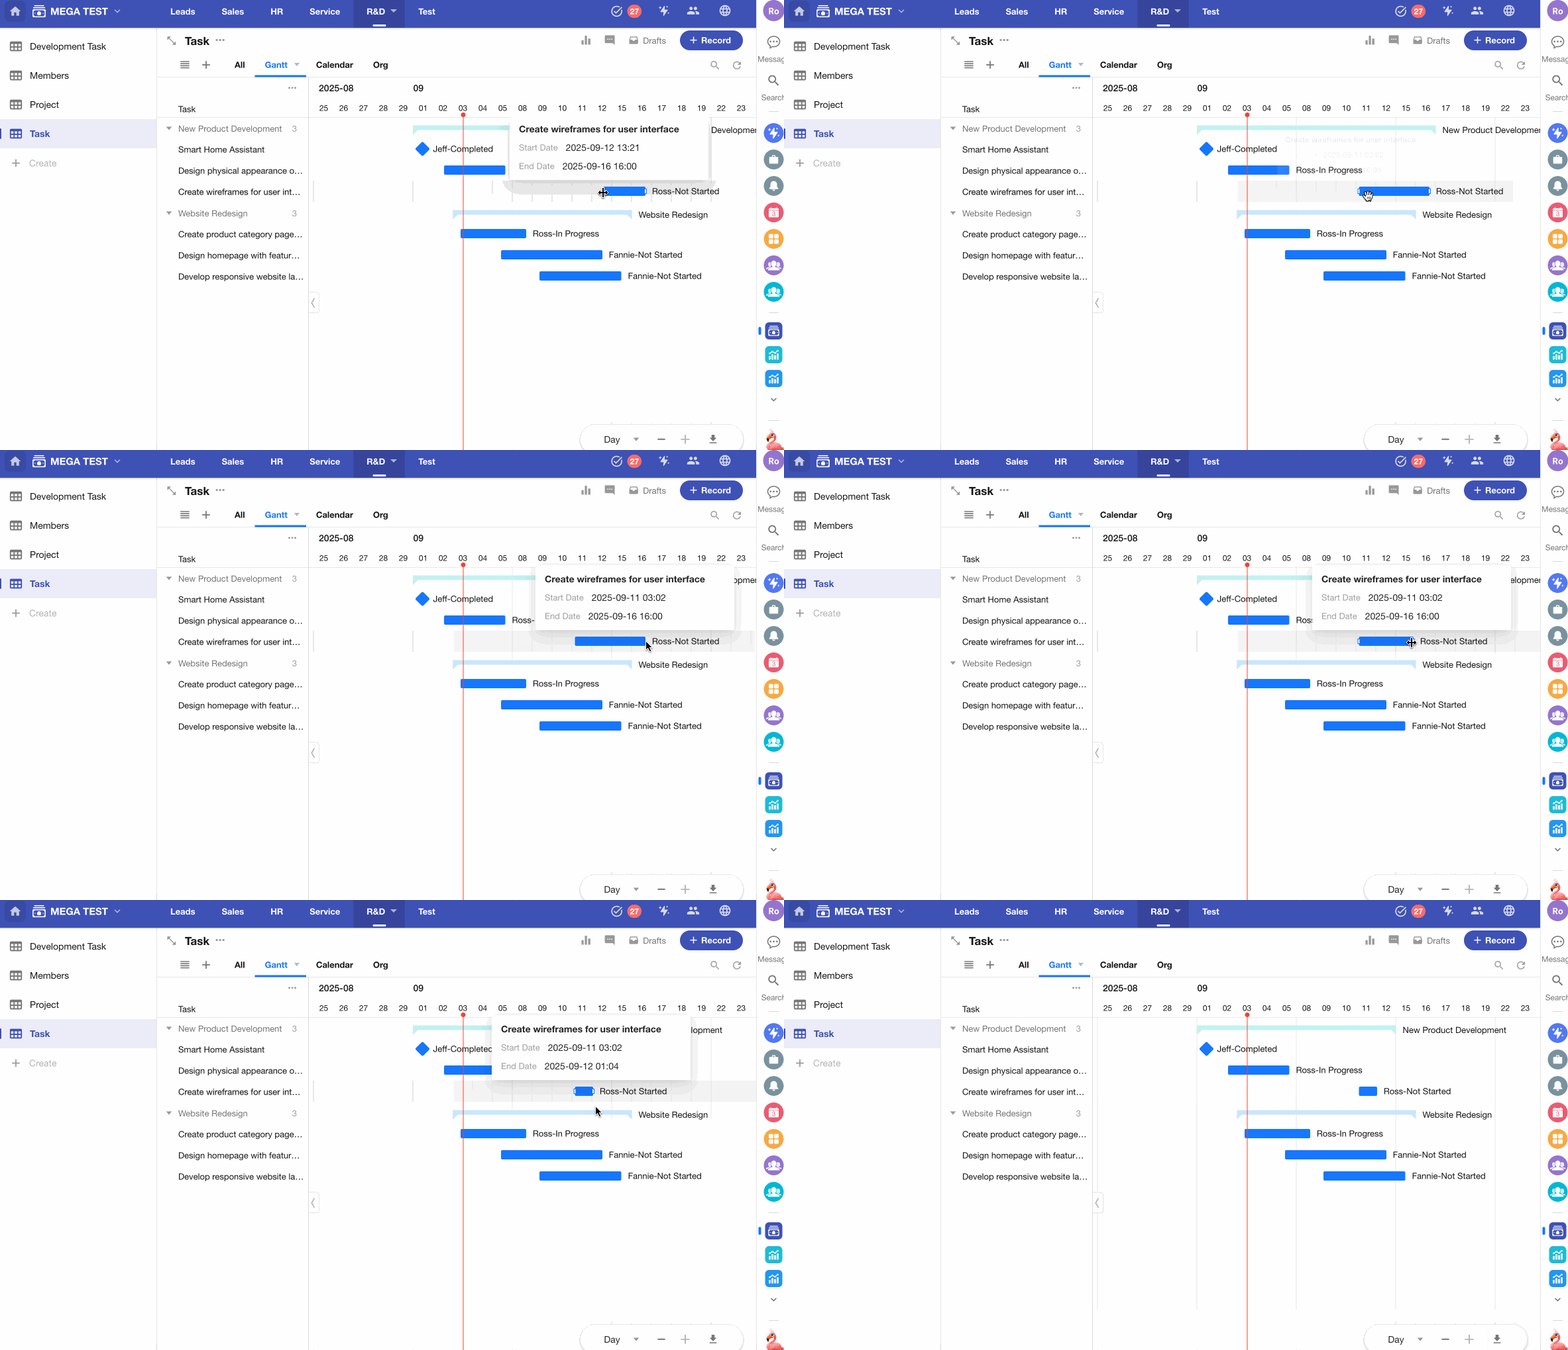
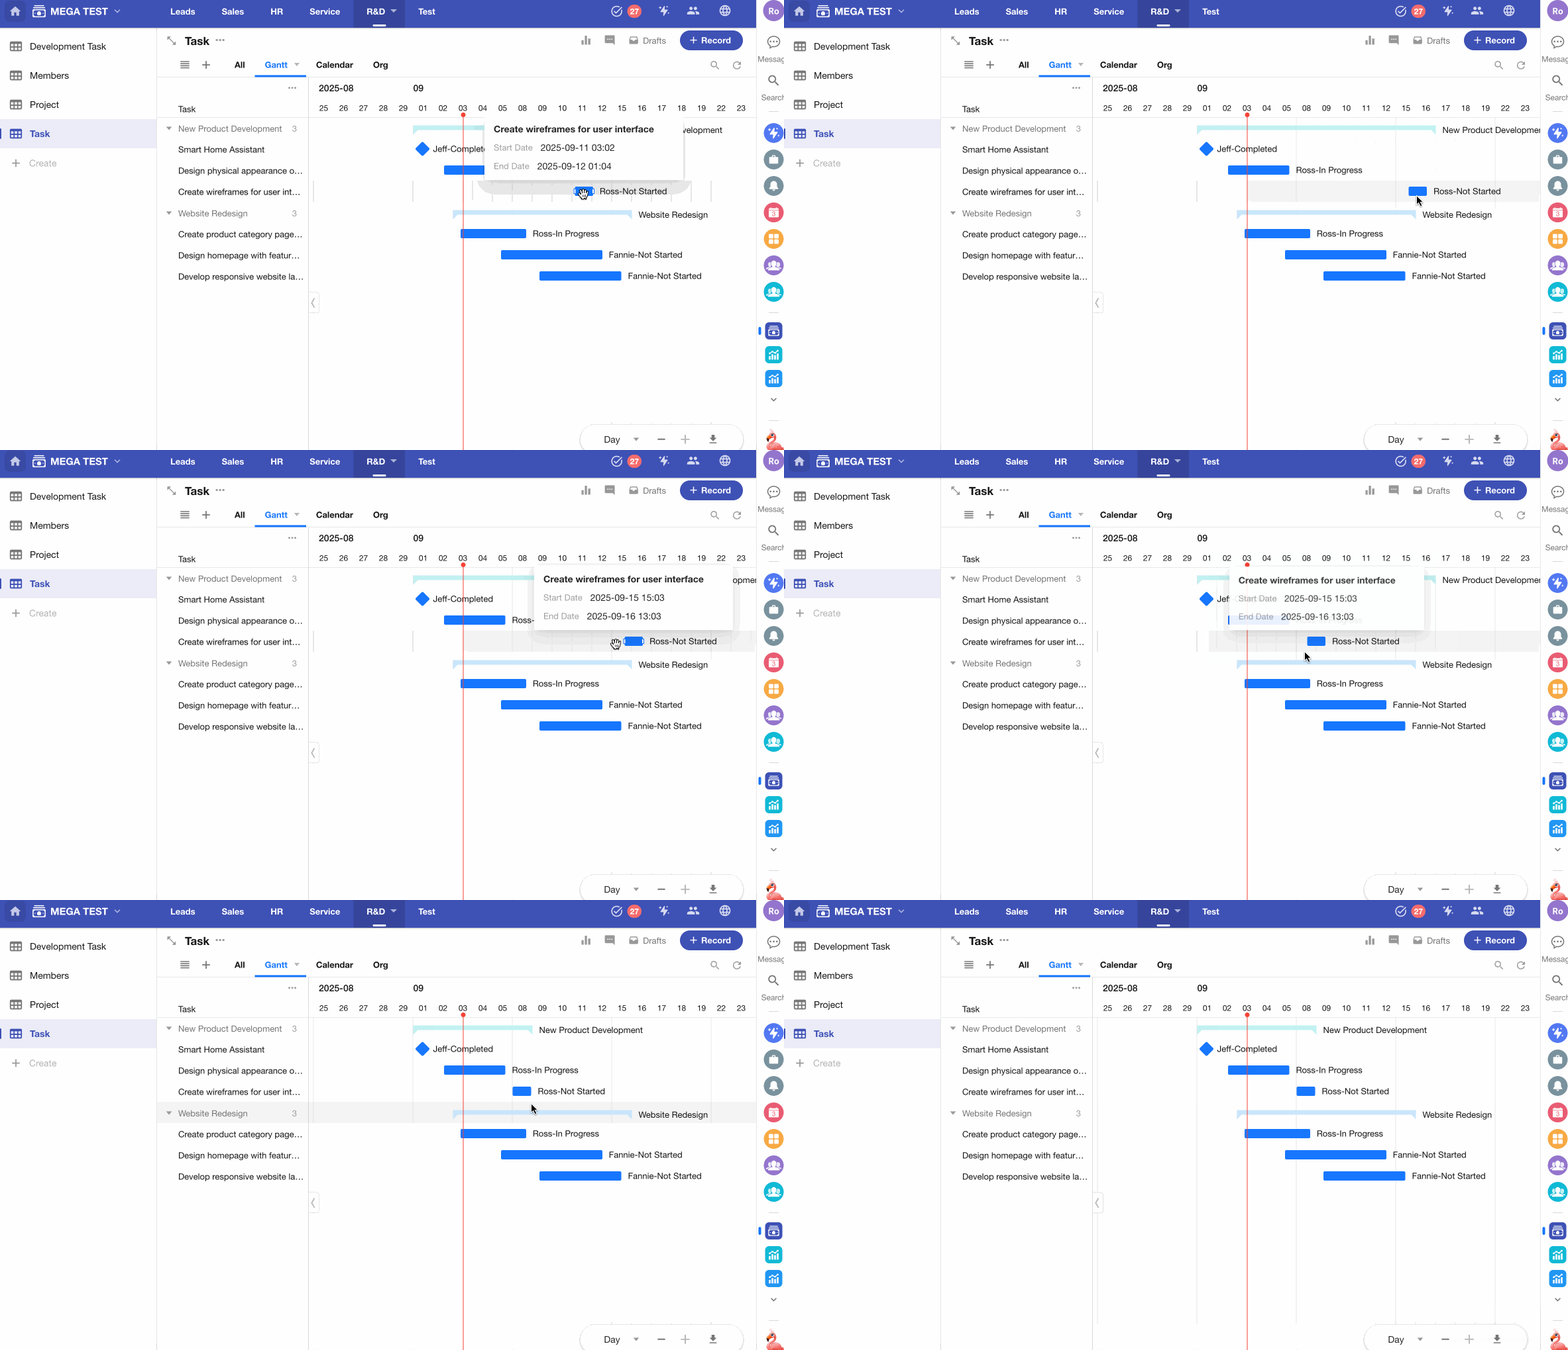
3. Drag to Adjust Dates
Drag task bars to change their start and end dates.
-
Drag from the bar’s edges to change start/end dates
-
Drag the full bar to shift the entire duration
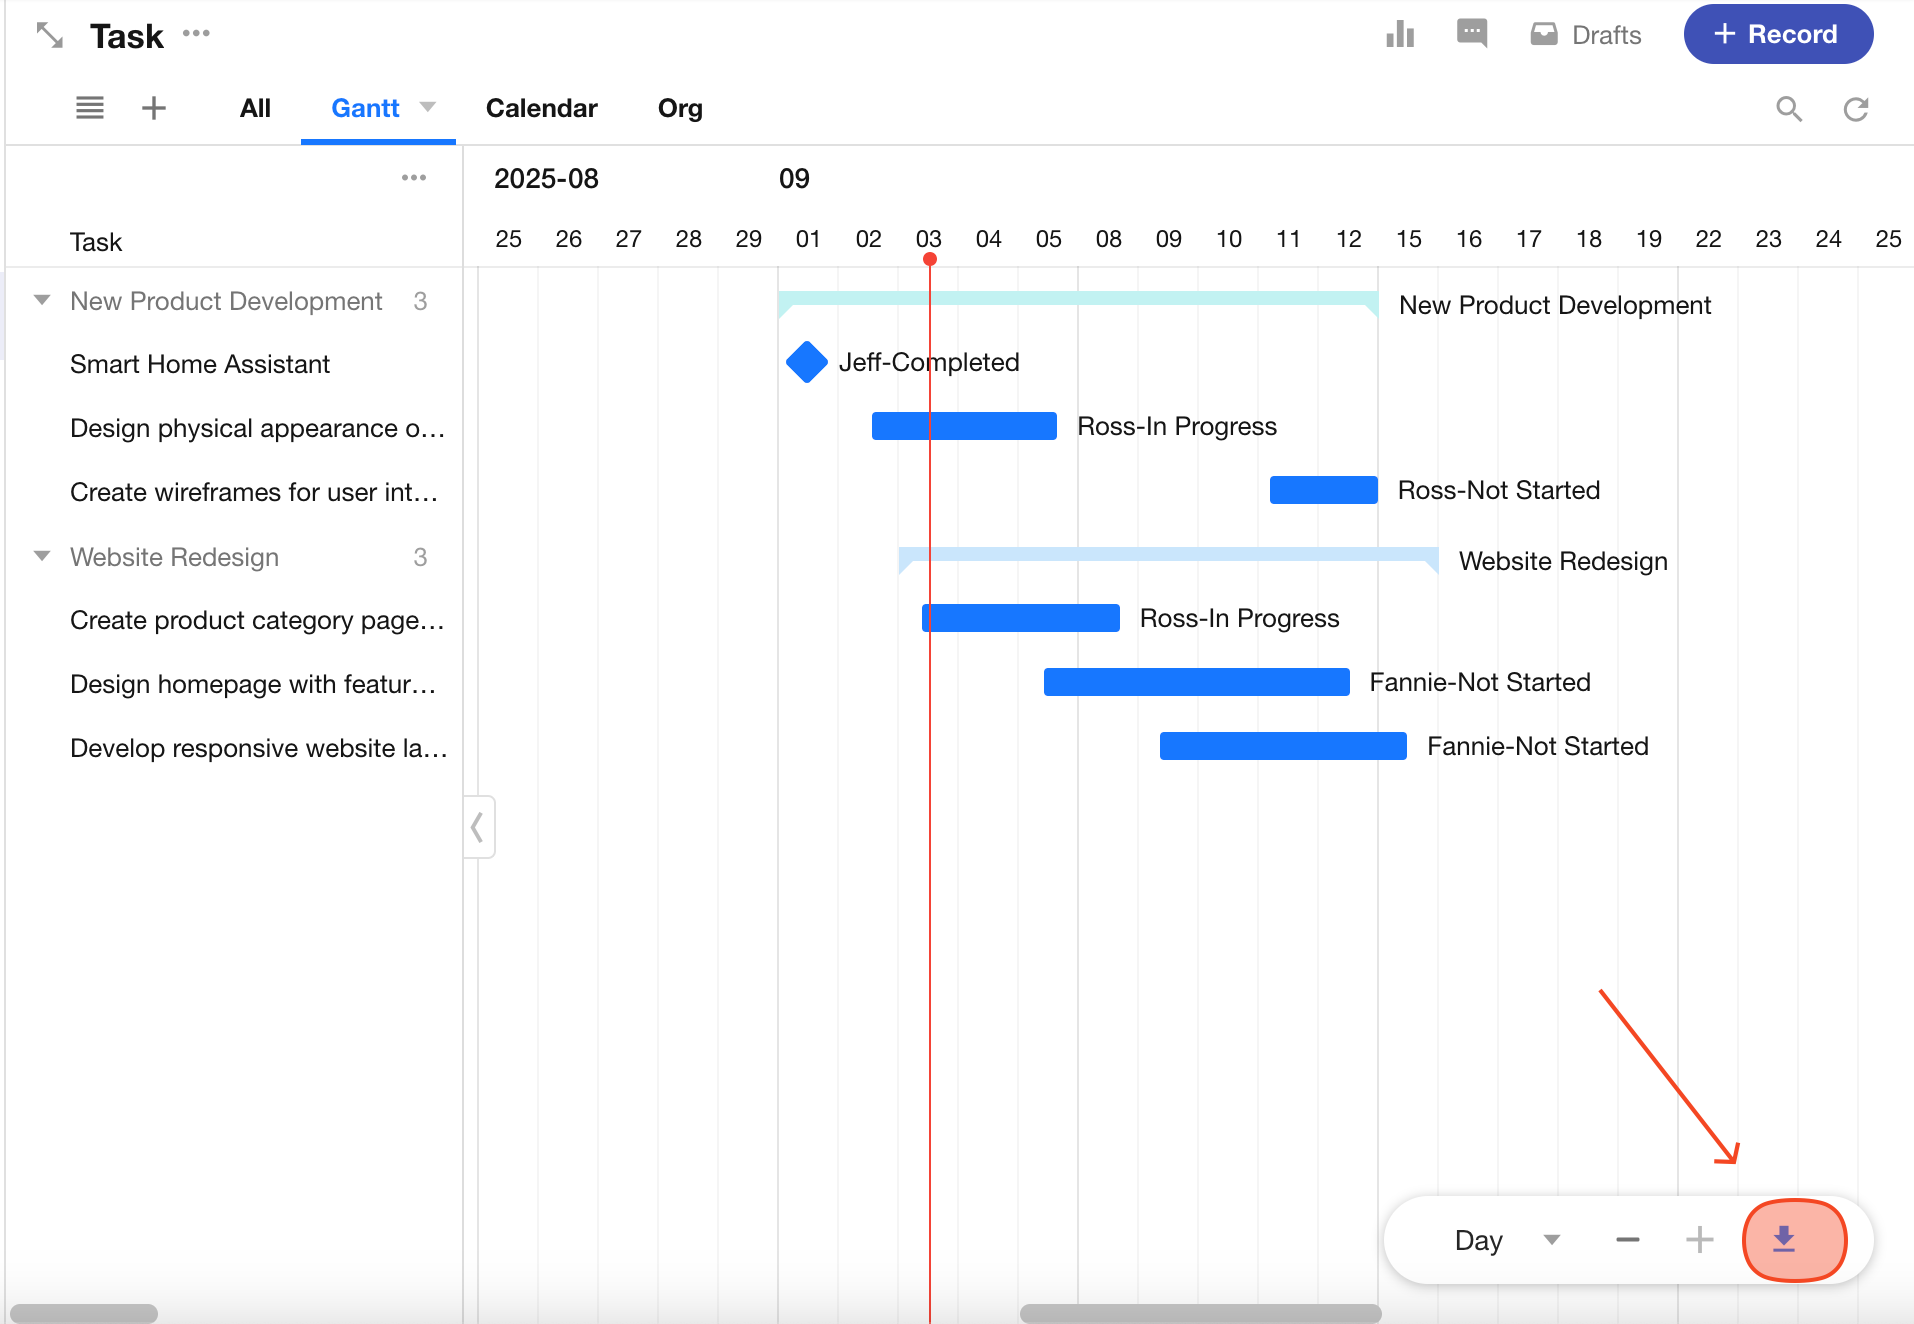
4. Export Gantt View
You can export the visible Gantt view as a PNG image.
5. Unscheduled Records
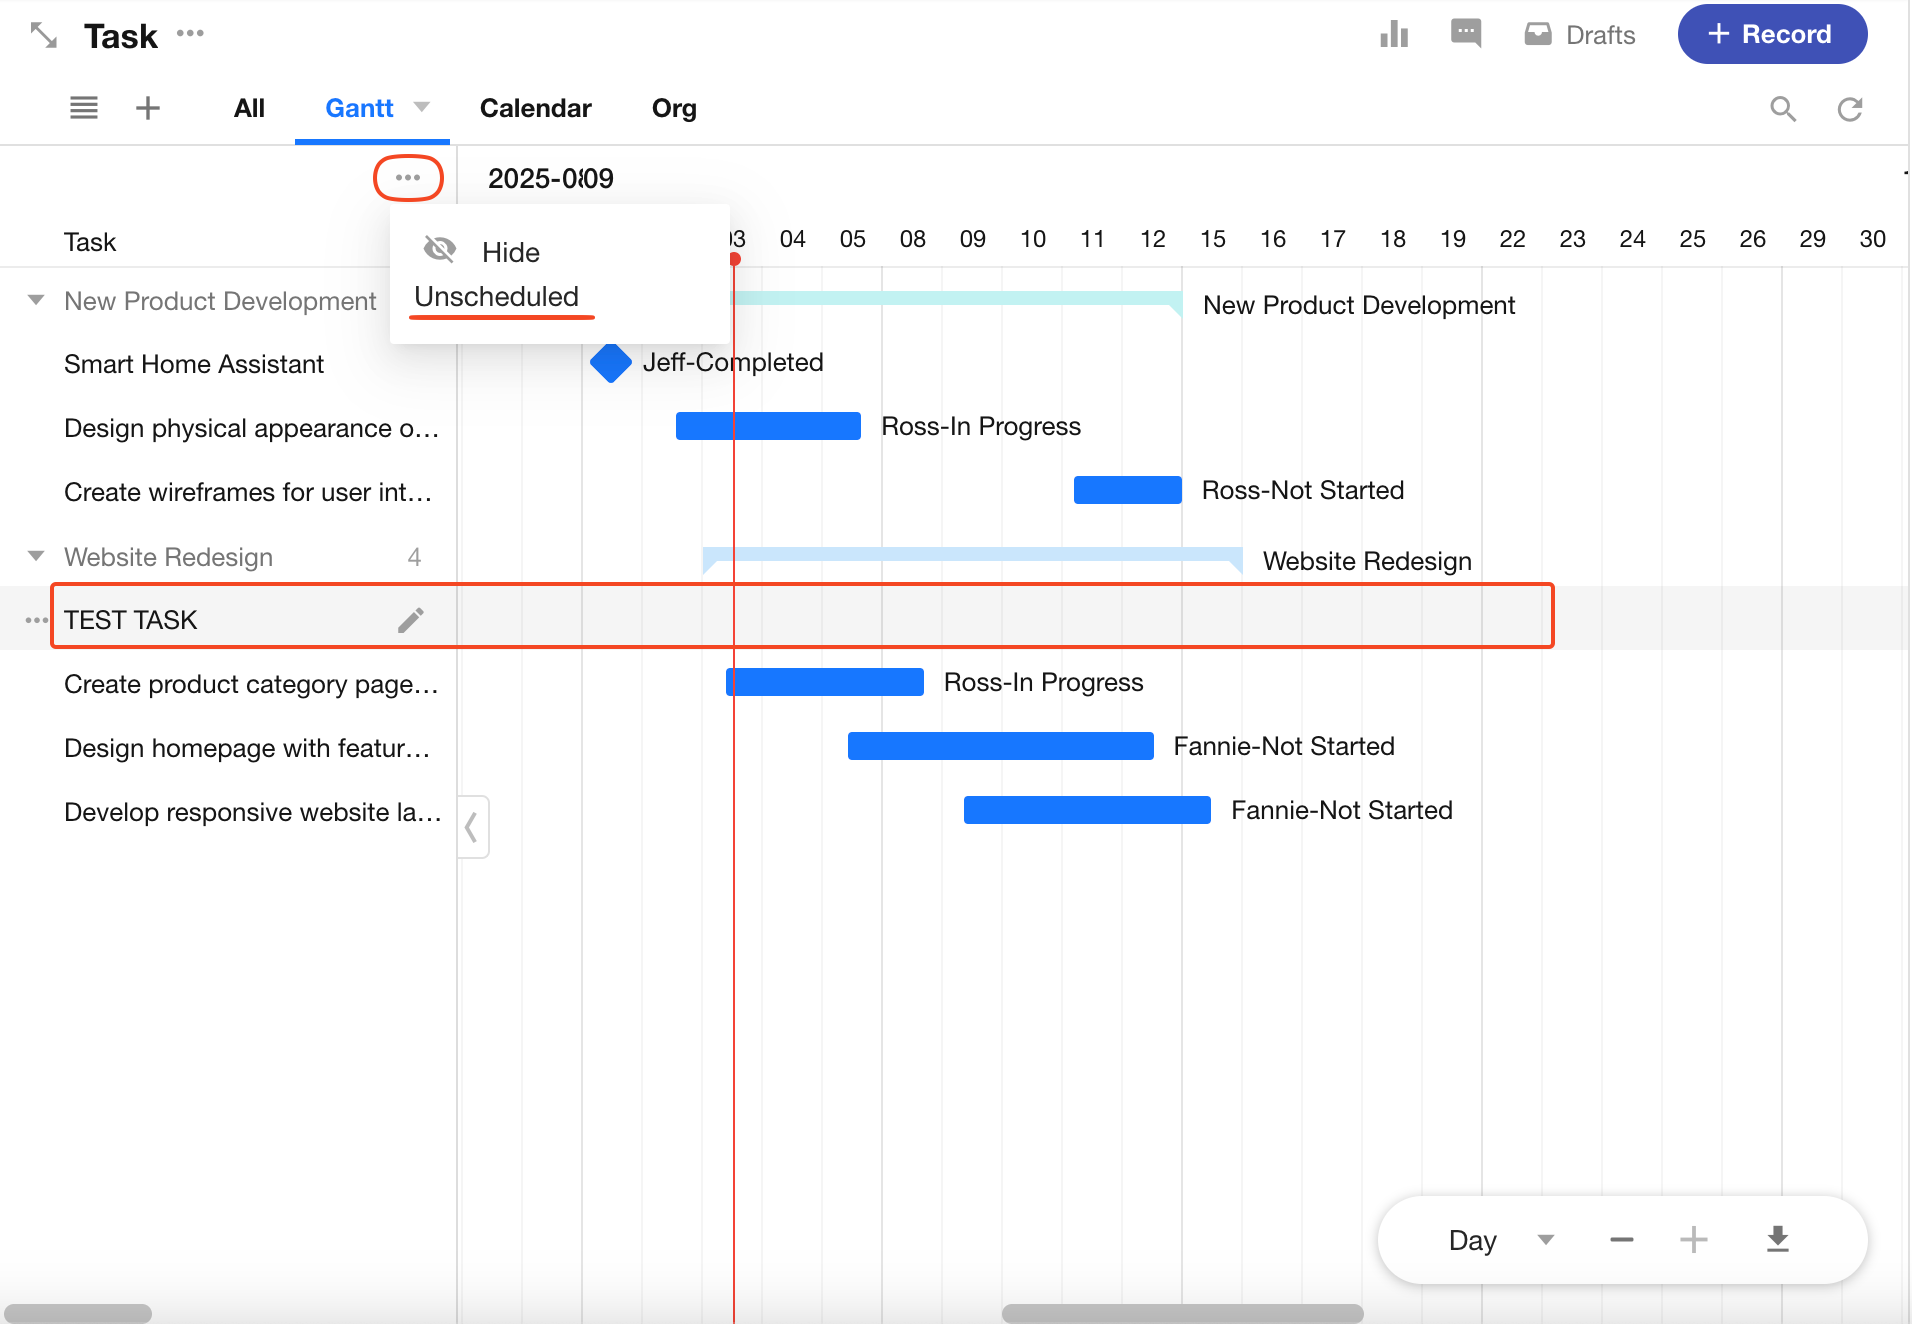
Records without both start and end dates are treated as “Unscheduled” and are hidden by default.
-
Show/hide unscheduled records
-
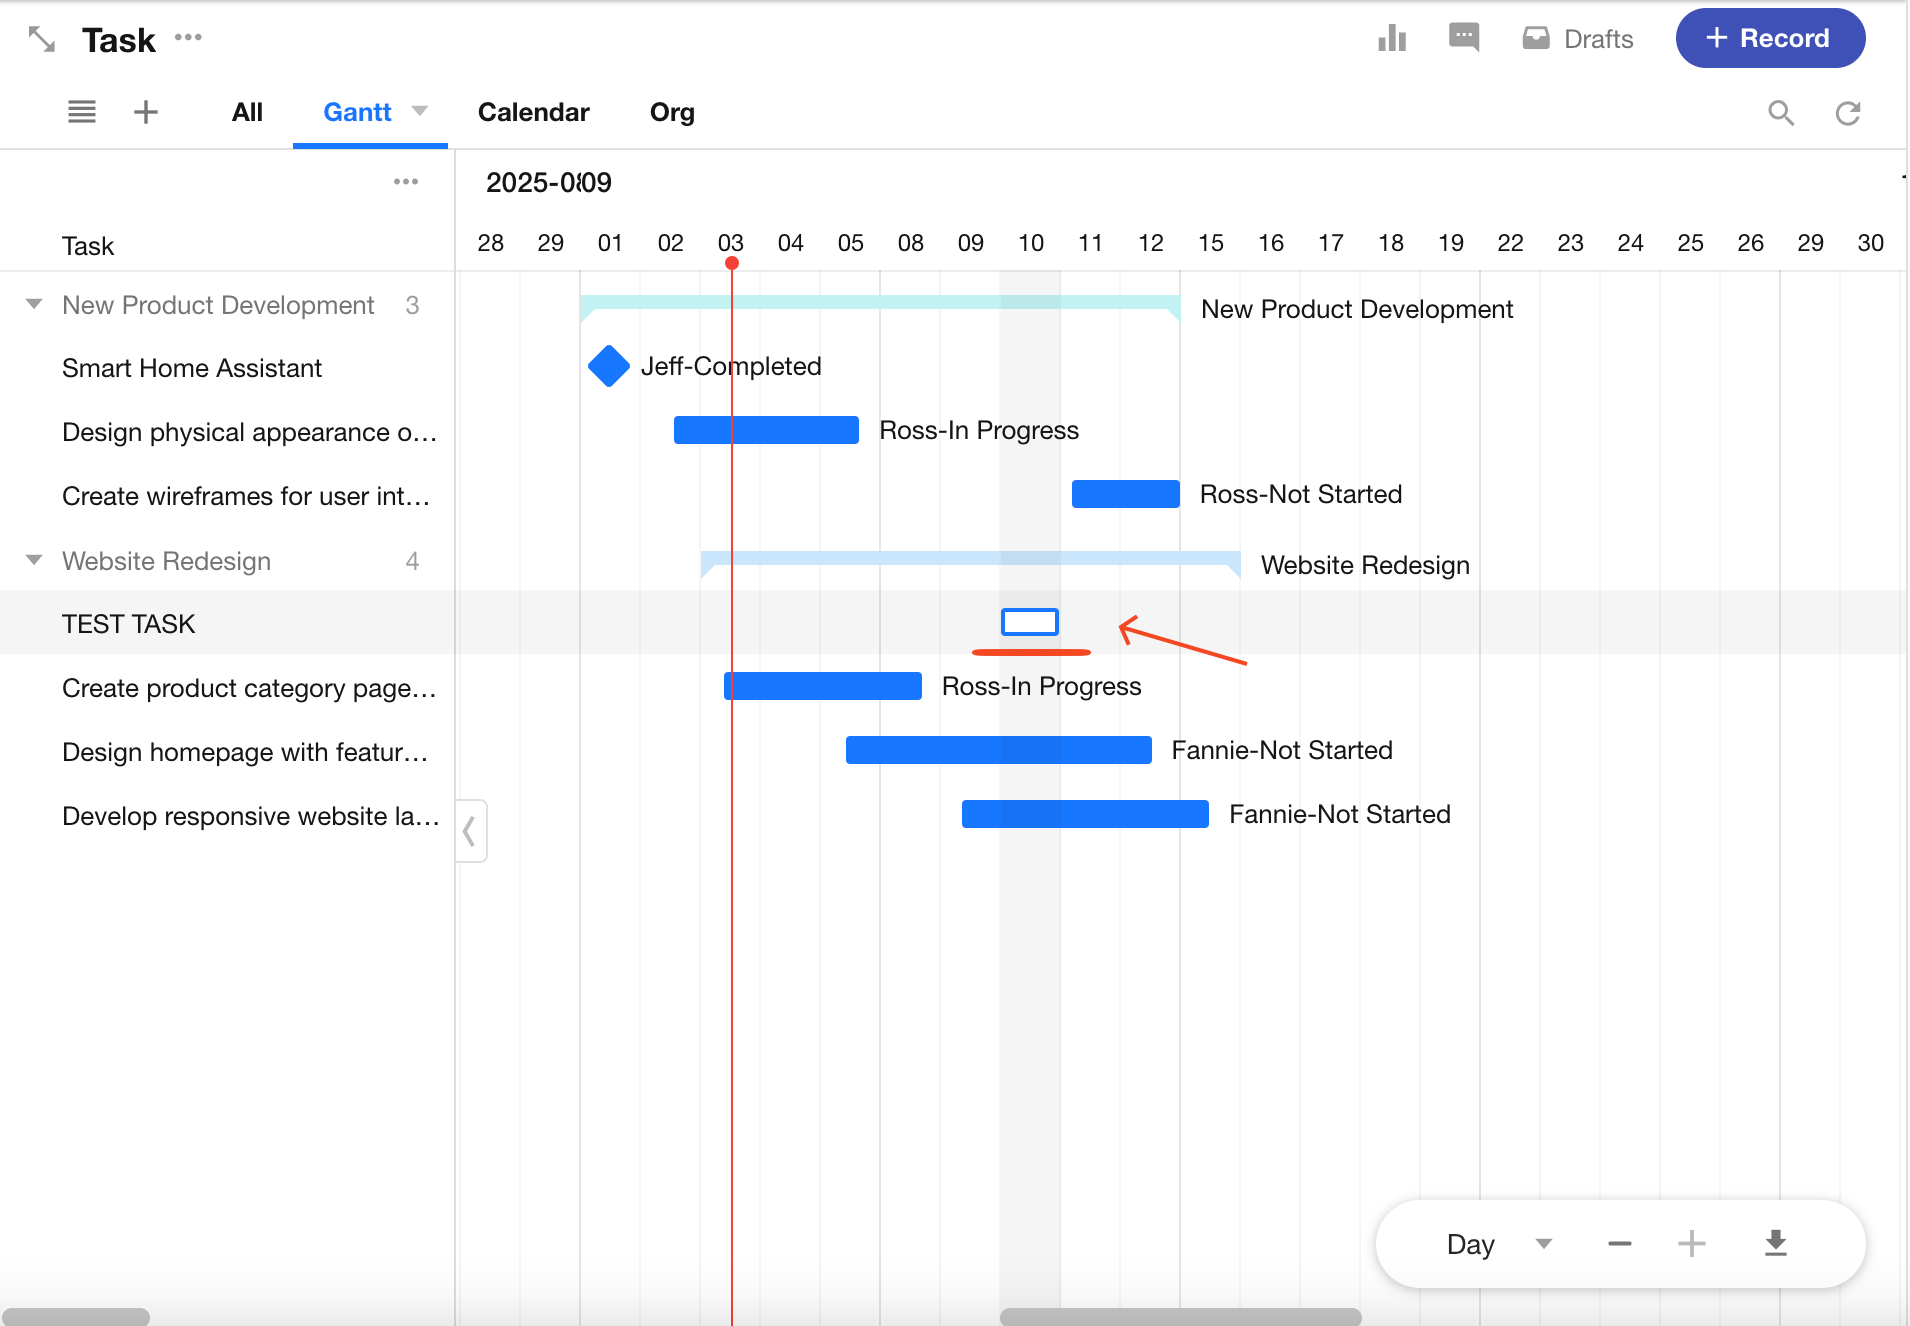
Click a date to quickly assign it as start/end date
6. Switch Timeline Precision
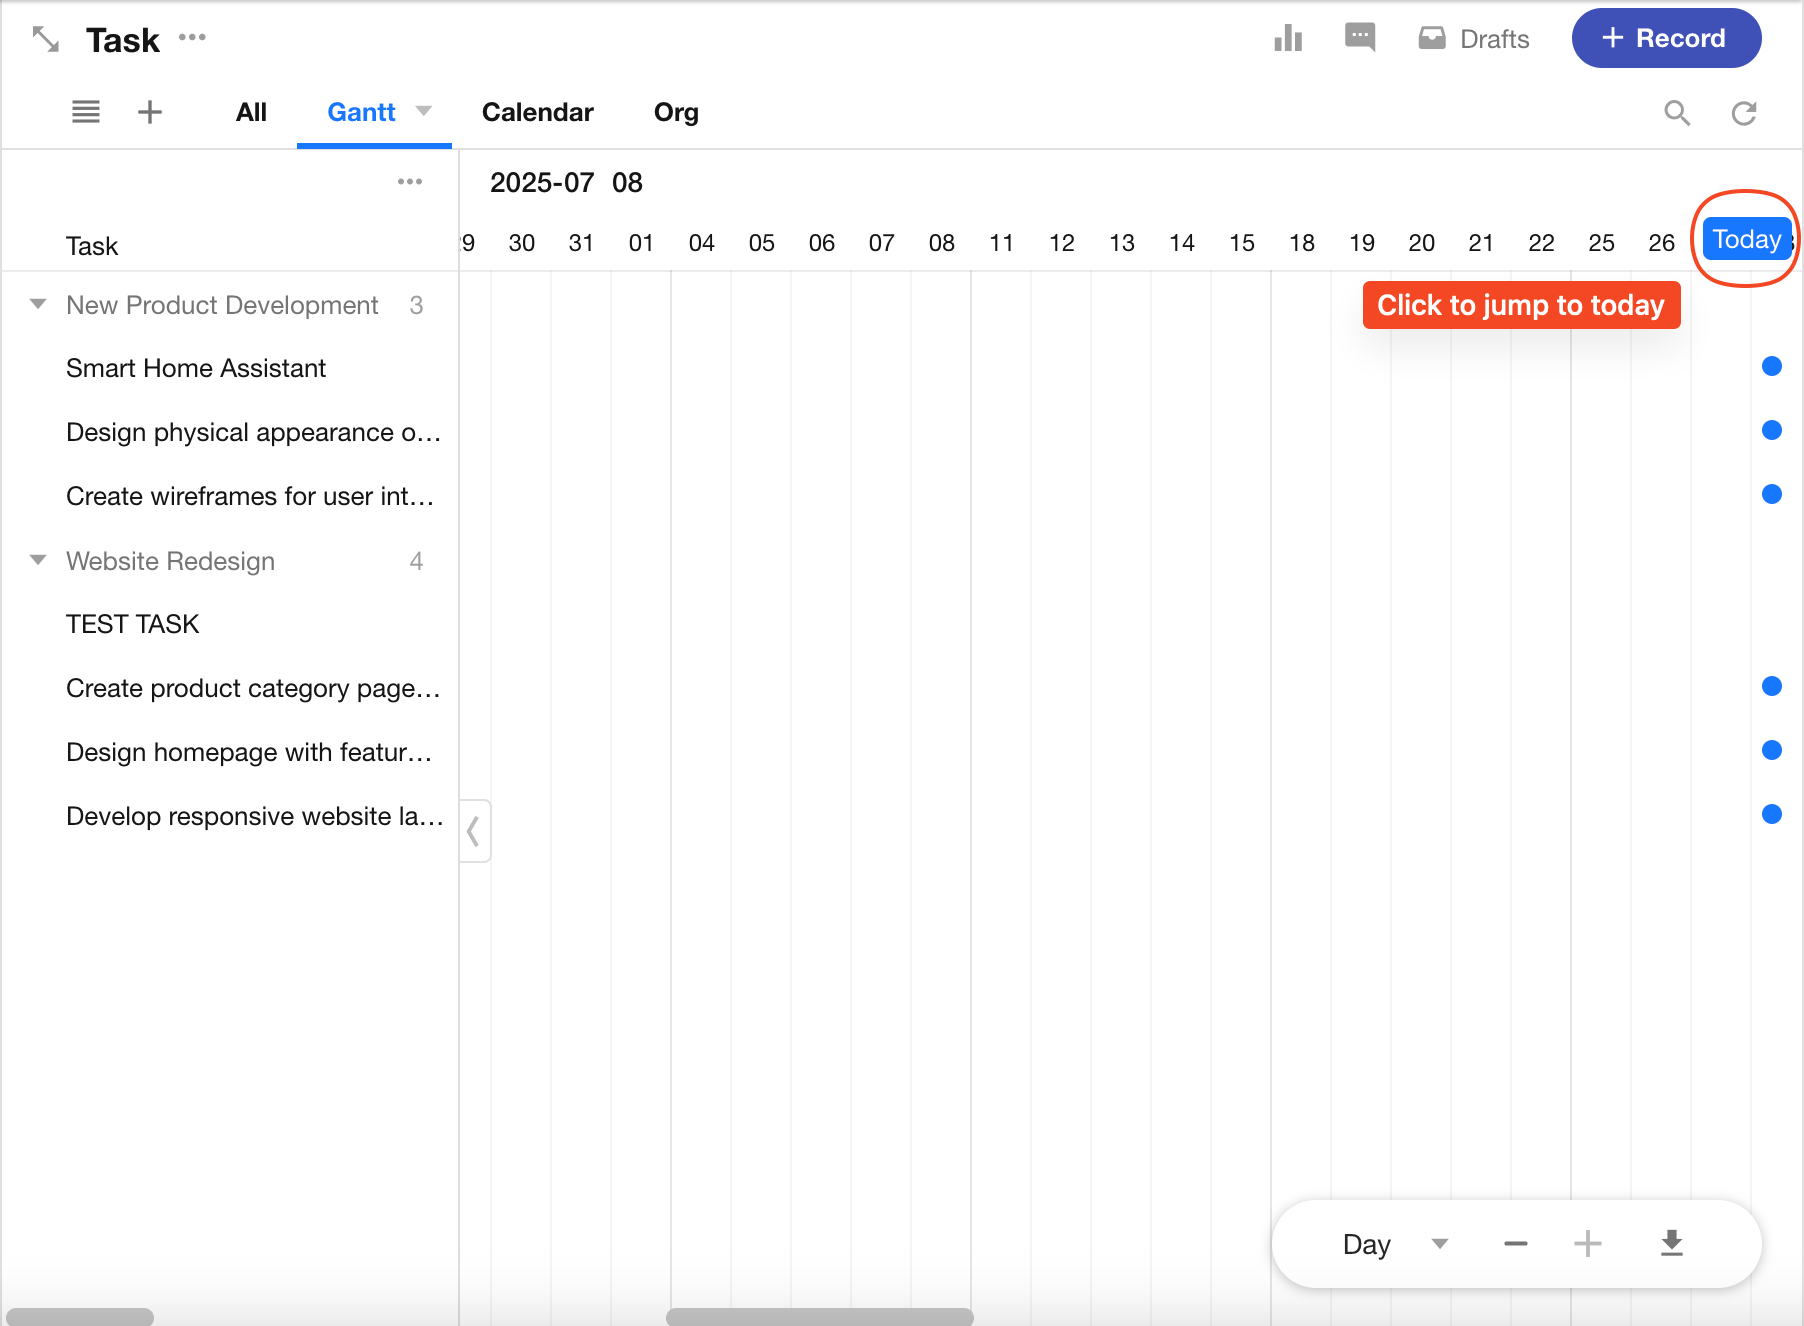
7. Jump to Today
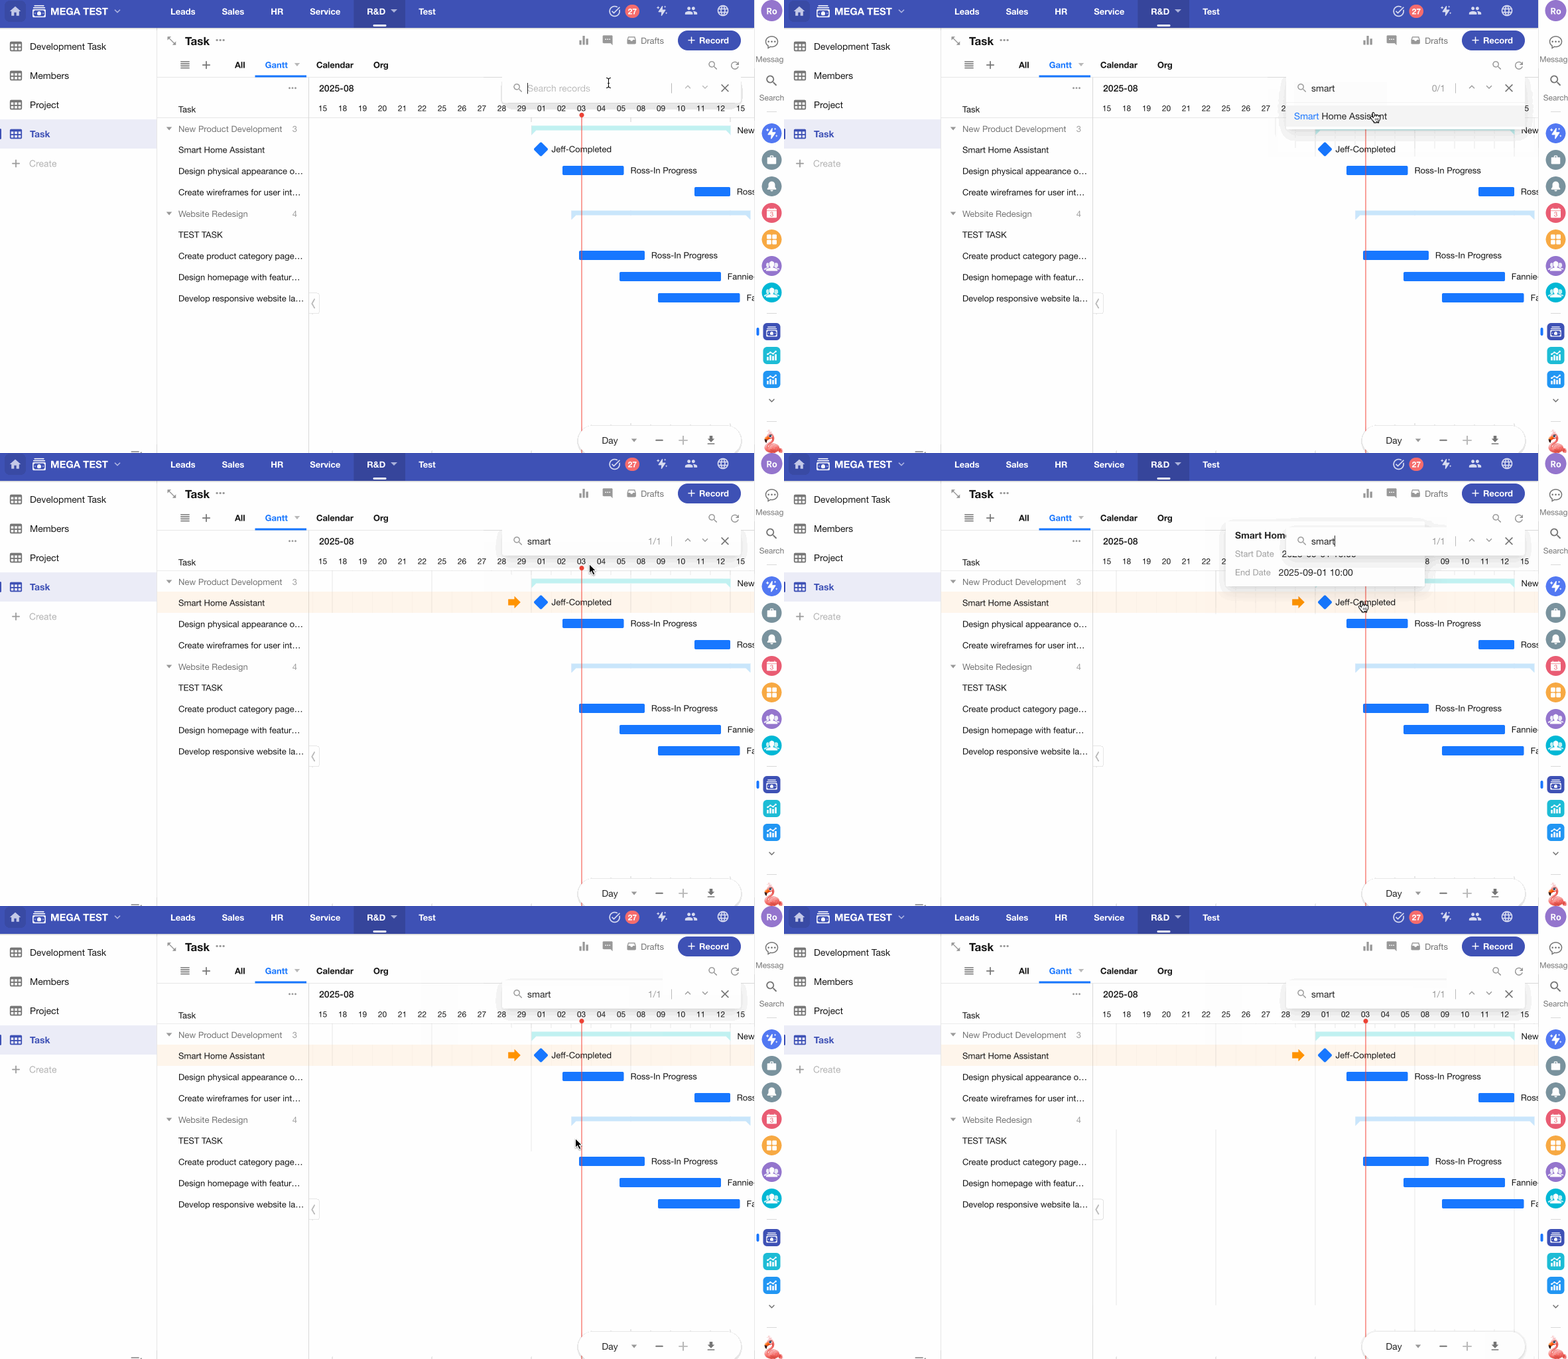
8. Search & Locate Records
Was this document helpful?