ER Diagram
An ER Diagram (Entity-Relationship Diagram) is a visual tool used to illustrate relationships between worksheets within an application.
In complex applications, there may be dozens or even hundreds of entities. This can lead to data redundancy, difficulty in permission management, and increased system maintenance complexity. The ER diagram helps application admins clarify complex data structures and relationships, providing a more intuitive view of the data model and improving communication and collaboration efficiency.
Using graphical symbols and connecting lines, the ER diagram clearly displays how entities—such as relationship fields and subform fields—are connected. It supports relationship types including one-to-one, one-to-many, and many-to-many.
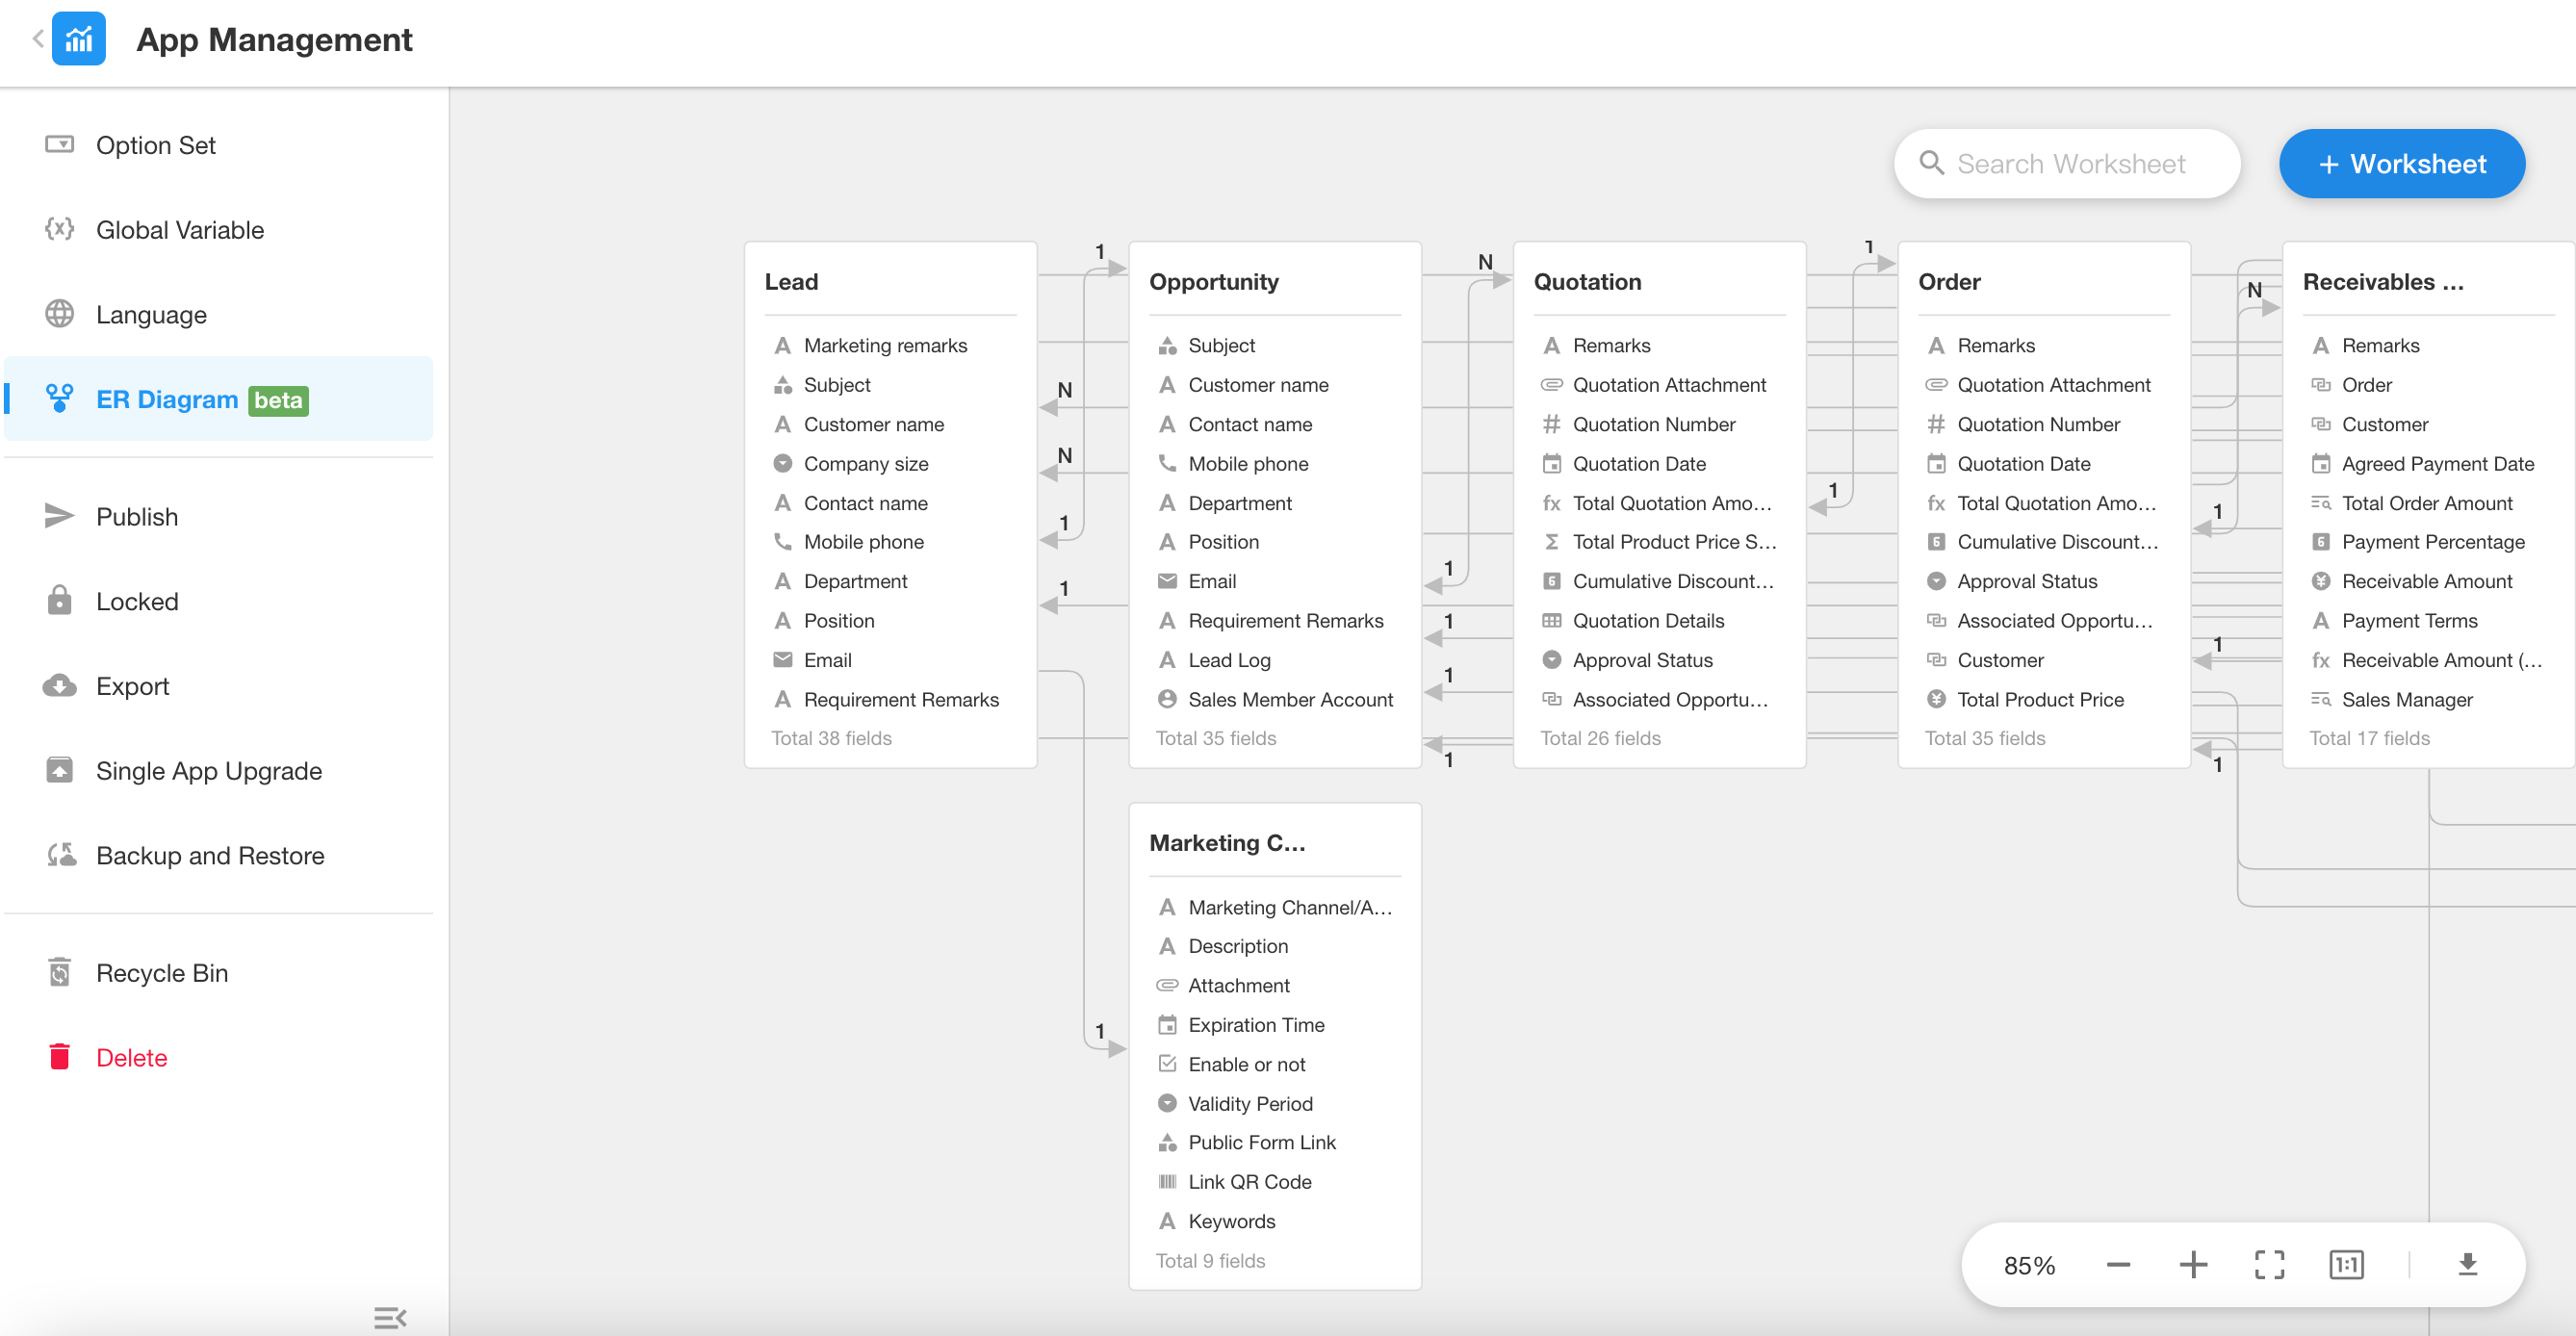
Example:
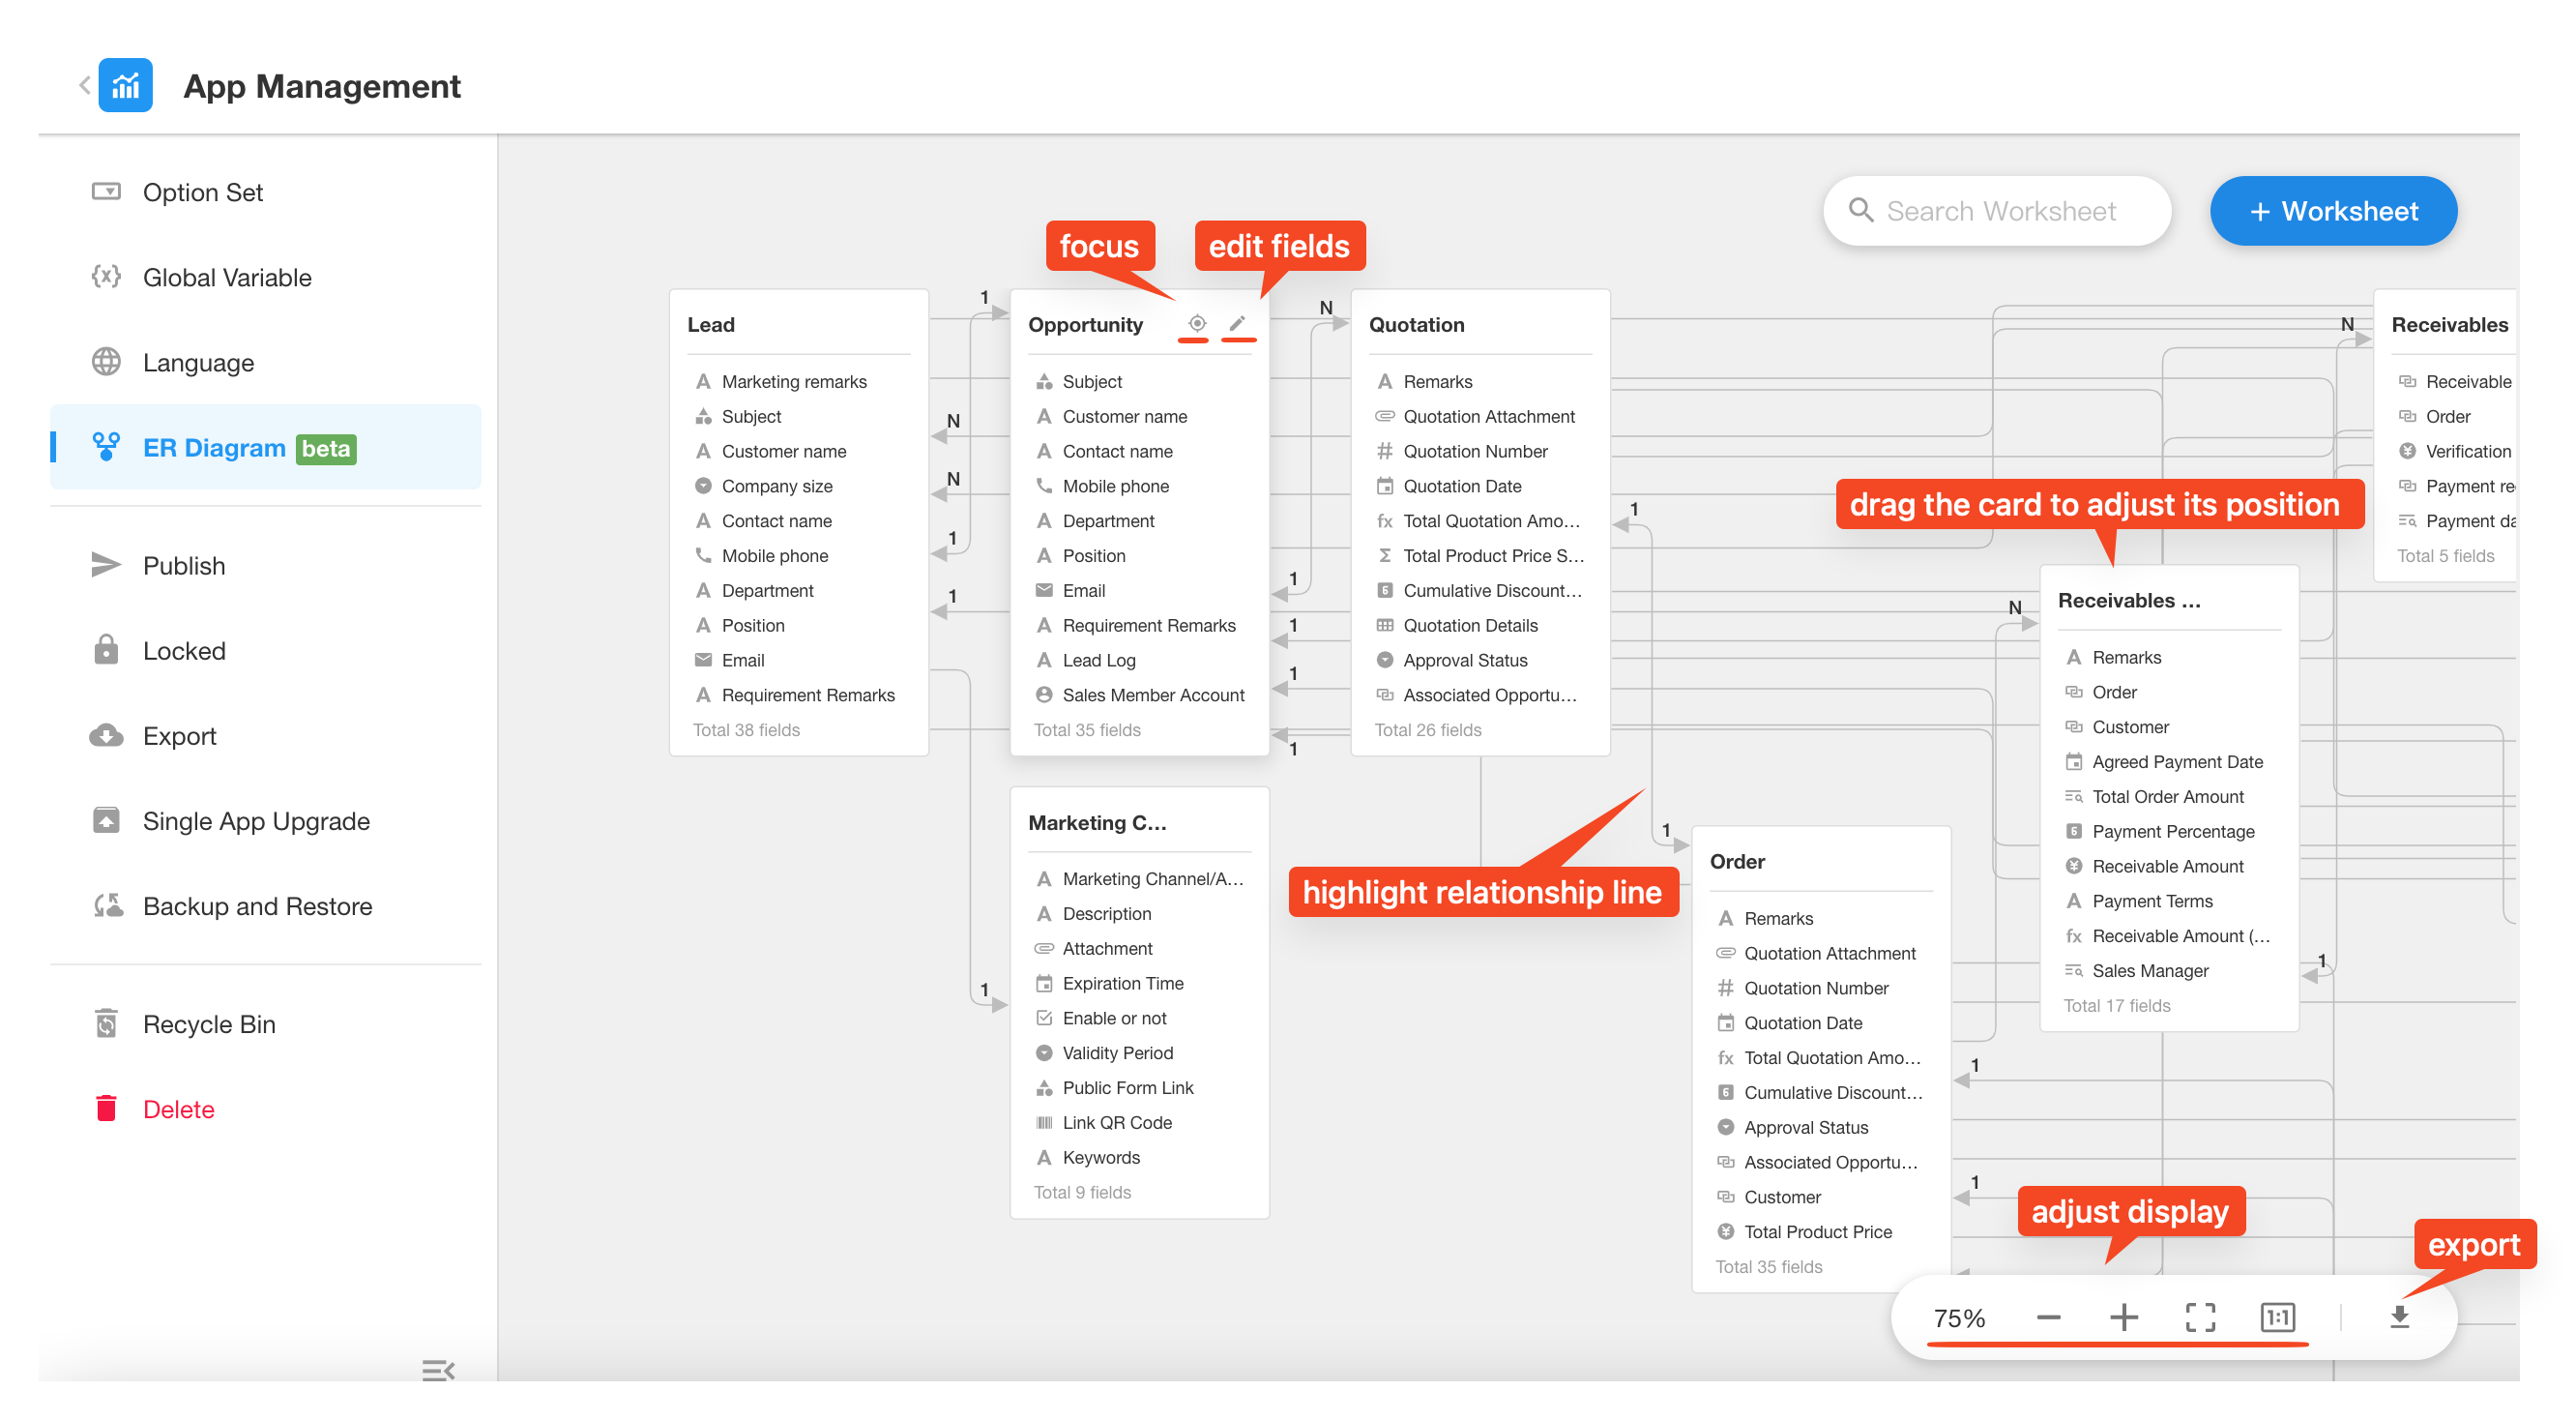
The diagram below illustrates the structure of each worksheet within an application and the relationships between them.
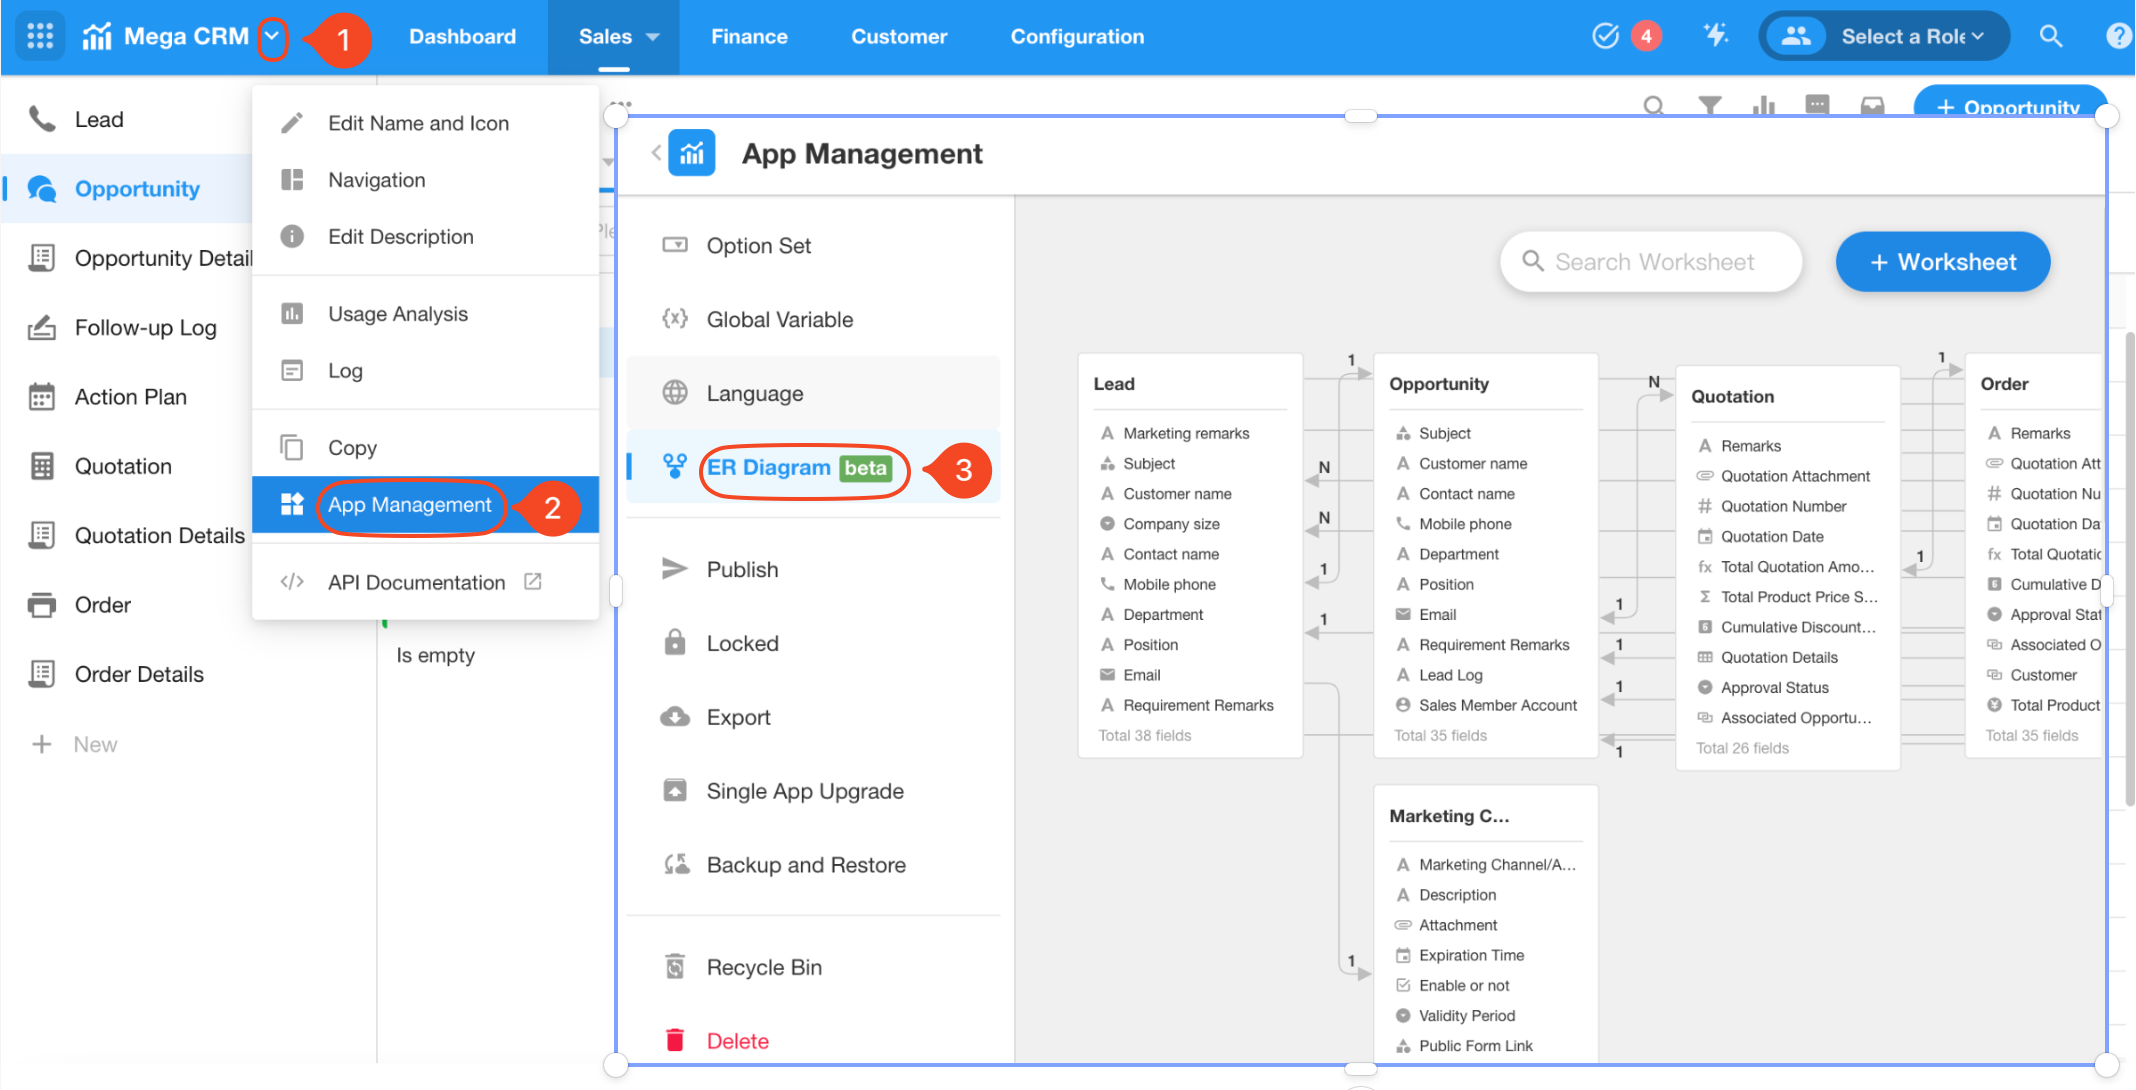
Access the ER Diagram
Application admins can navigate to [App Management] > [ER Diagram] to view the relationship diagram of the current application.
Relationship Lines
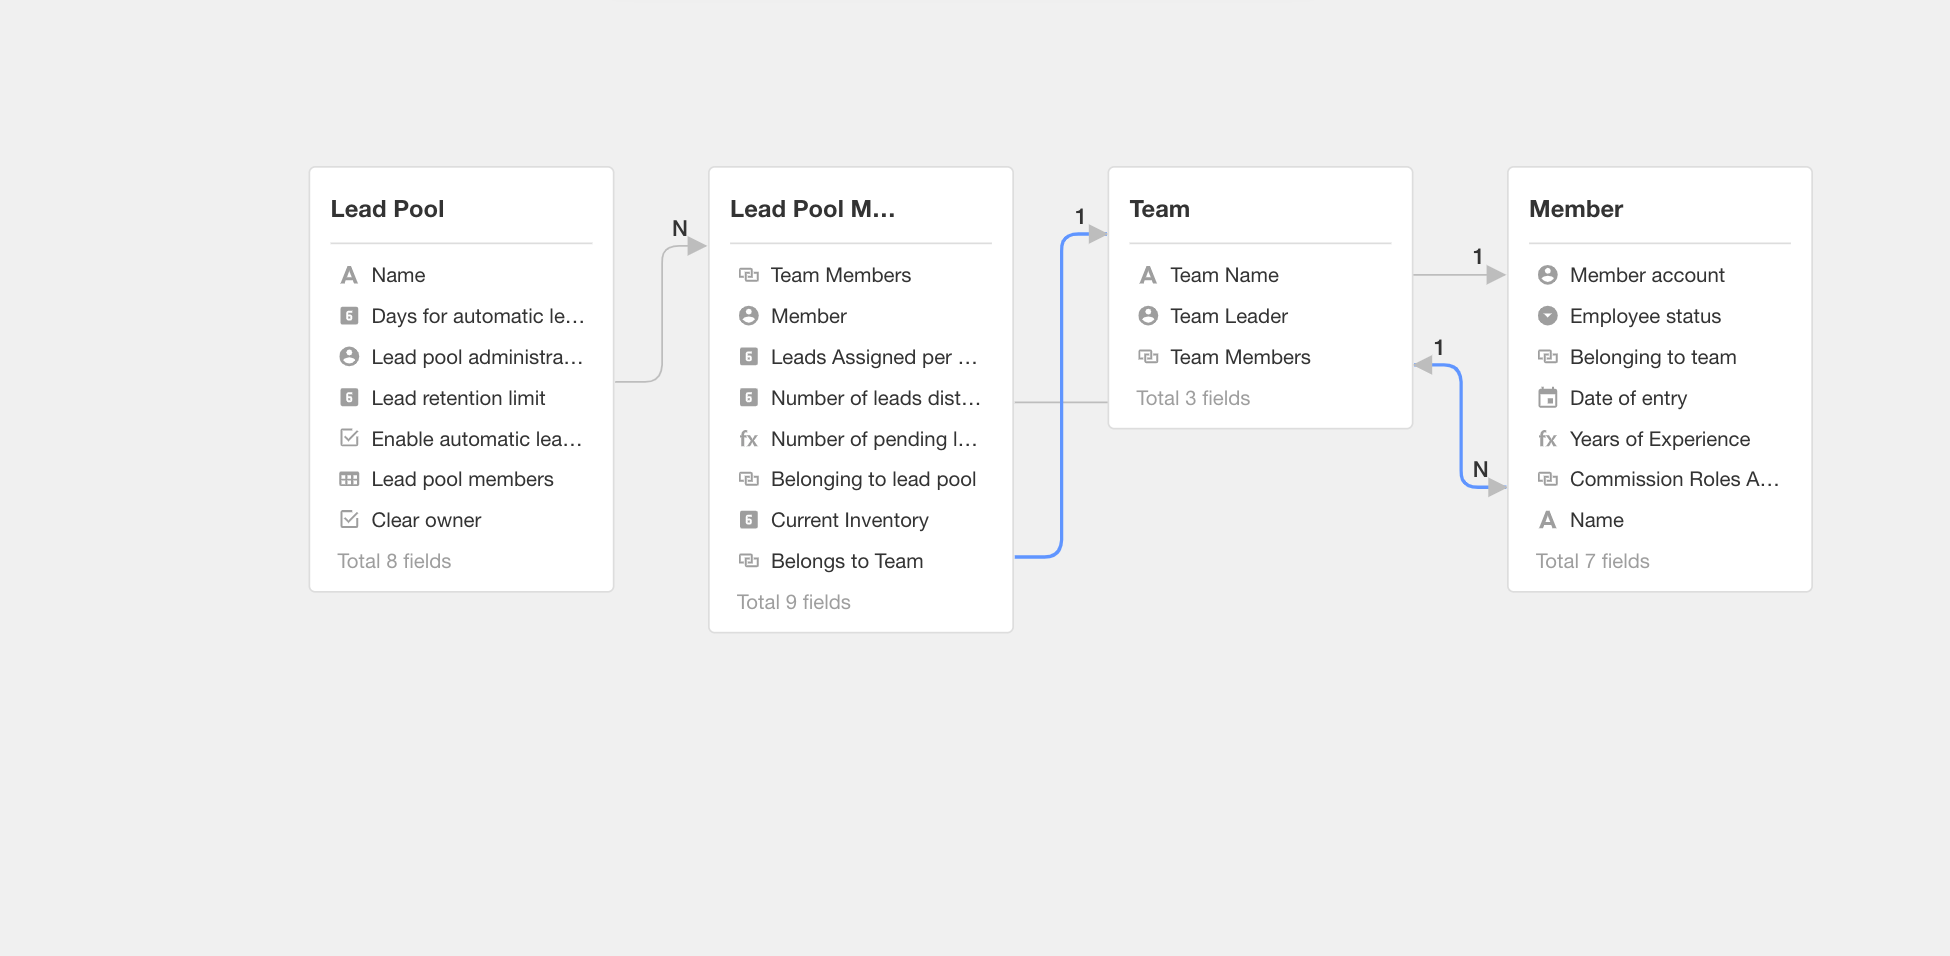
The connecting lines and numbers in the diagram describe the relationships between two worksheets.
-
Direction: One-Way vs. Two-Way
-
If only one end of the relationship line has an arrow, it indicates a one-way relationship.
-
If both ends have arrows, it indicates a two-way relationship.
-
-
Relationship Type
-
A number “1” above the arrow indicates a single related record.
-
“N” indicates multiple related records.
-
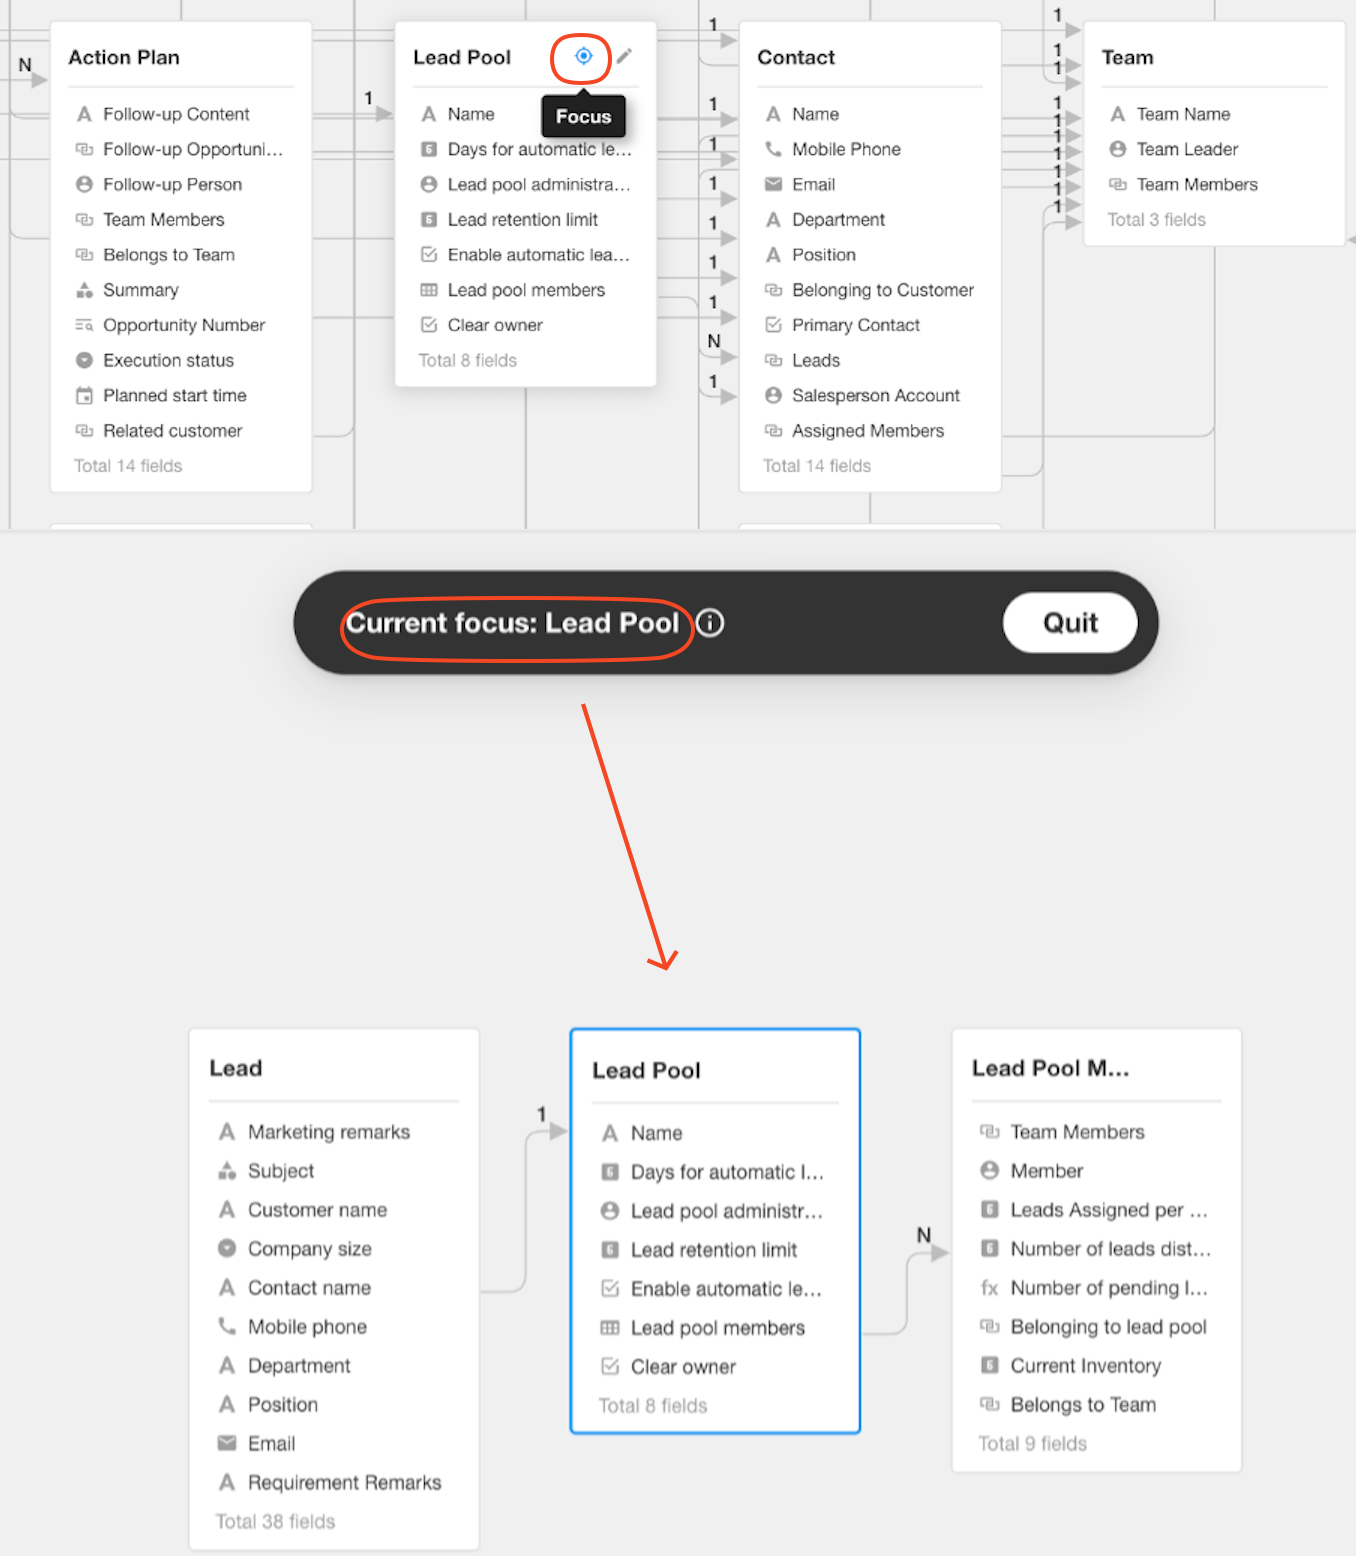
Focus View
Click the Focus button on a worksheet card to display only the worksheets that have direct relationships with the selected worksheet, along with their connections.
Additional Features
Within the ER diagram canvas, you can also perform the following actions:
- Hover over a worksheet card and click the Edit button to modify worksheet fields directly.
- Drag worksheet cards to adjust their position on the canvas.
- Click a relationship line to highlight it.
- Create a new worksheet or search for an existing one.
- Adjust the canvas zoom level.
- Export the ER diagram.
Was this document helpful?